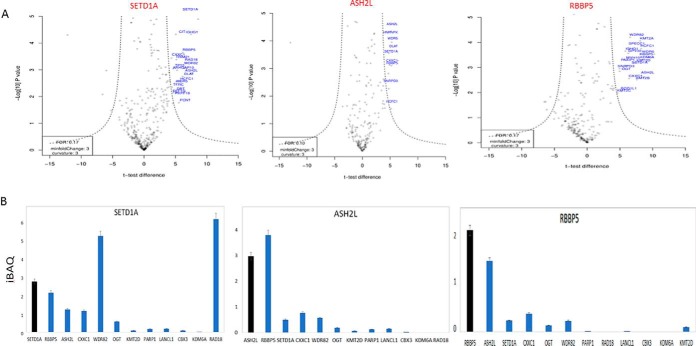
Fig. 2.
Physical interactions of SETD1A-complex subunits. A, Volcano plot projects differences in t test scores (between specific and control immunoprecipitations), against log-transformed t test p values for the SETD1A, RBBP5, and ASH2L experiments using the msVolcano program. The data is based on the MaxQuant LFQ score. Previously described SETD1A-complex component proteins are labeled in red. B, LFQ scores were adjusted using the iBAQ algorithm to plot relative stoichiometry data for previously-described SETD1A-interacting proteins, and for RAD18.

