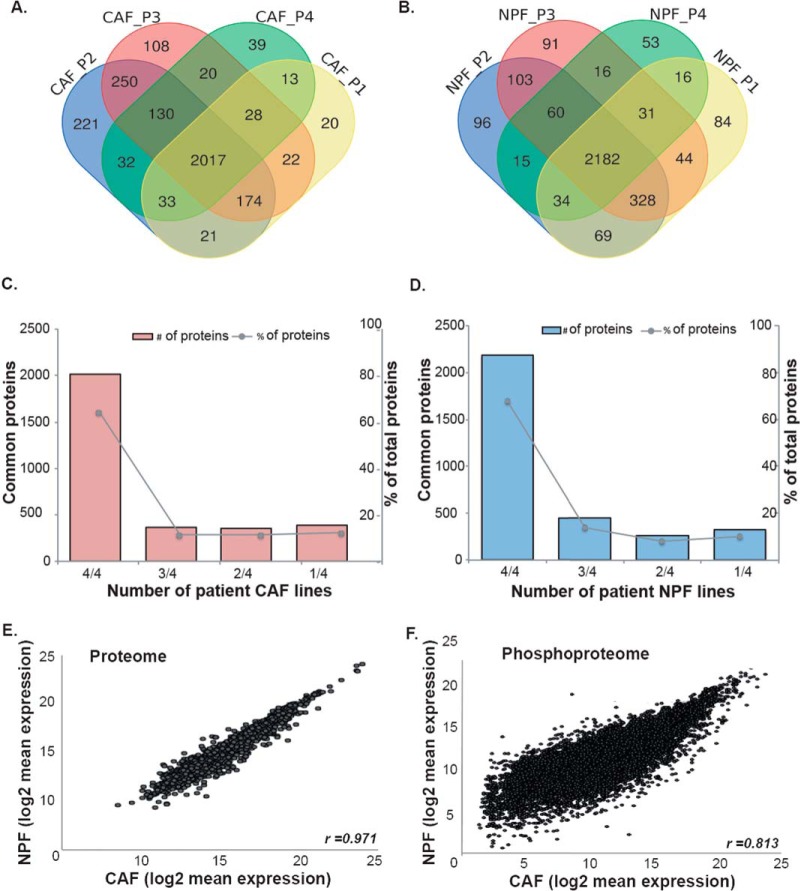
Fig. 1.
Comparison of the proteomes and phosphoproteomes of prostate CAF and NPF. Venn diagrams of overlapping proteins identified in the spectral library of the (A) CAF proteome and (B) NPF proteome. Bar graphs of common proteins (left axis) and the percentage of total identified proteins (right axis) in each number of patient cell lines in the spectral library of (C) CAF proteome and (D) NPF proteome. Scatter plots comparing the average log2 expression of (E) individual proteins and (F) phosphopeptides in matched CAF versus NPF patient-derived lines (n = 4).

