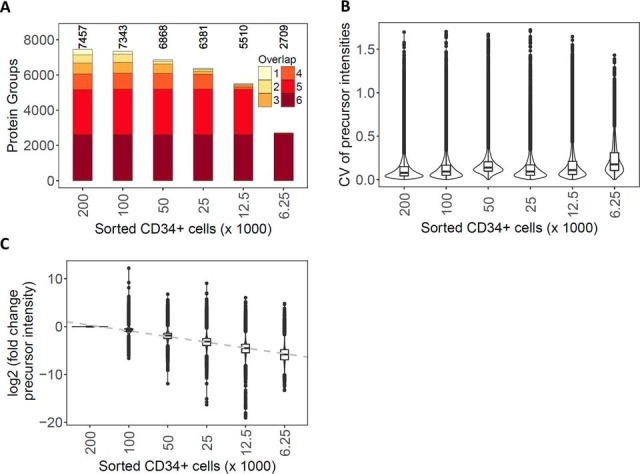
Fig. 2.

Dilution series of human CD34+ hematopoietic cells isolated by FACS. (A) Number of protein groups cumulatively identified across the technical replicates for decreasing numbers of FACS-isolated human CD34+ hematopoietic cells. The color scale represents the consistency of protein group identifications across the runs. (B) Distribution of the CV for the peptide precursor intensities for the technical (process) triplicate injections of processed FACS-isolated cells. (C) Distribution of the fold change (in log2 scale) of the average precursor intensities between a given sample load and that at 200,000 FACS-isolated human CD34+ hematopoietic cells.
