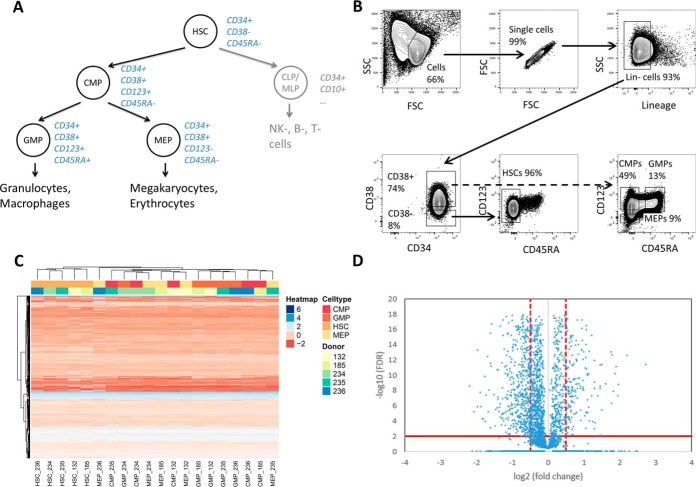
Fig. 3.
Proteome profiles of human hematopoietic stem and progenitor cell subpopulations. (A) Human hematopoietic cell hierarchy with respective cell surface markers depicted in blue (15–17). (B) FACS strategy, depicted on magnetic-activated cell sorting-preselected CD34+ hematopoietic cells isolated from healthy HSPC donors. Shown are the analysis gates. Highly enriched HSCs/MPPs (referred to as HSCs) are CD34+CD38-CD45RA-, highly enriched CMPs are CD34+CD38+CD123+CD45RA-, highly enriched GMPs are CD34+CD38+CD123+CD45RA+, and highly enriched MEPs are CD34+CD38+CD123-CD45RA-. (C) Nonsupervised hierarchical clustering (Euclidean distance) heatmap (78) of intensities for the peptides identified in HSCs, CMPs, GMPs, and MEPs (shades of red) isolated from five different donors (shades of blue). The peptide intensities are centered and scaled and depicted in color shades from red to blue. The missing peptide intensity values are shown in white. (D) Volcano plot of differential analysis of proteins. Comparison of HSCs to the average of the three other cell types. Abbreviations: HSPC, hematopoietic stem and progenitor cell; HSC, hematopoietic stem/multipotent progenitor cell; CMP, common myeloid progenitor; CLP/MLP, common/multipotent lymphoid progenitor; GMP, granulocyte-macrophage progenitor; MEP, megakaryocyte-erythrocyte progenitor; SSC, side scatter; FSC, forward scatter.

