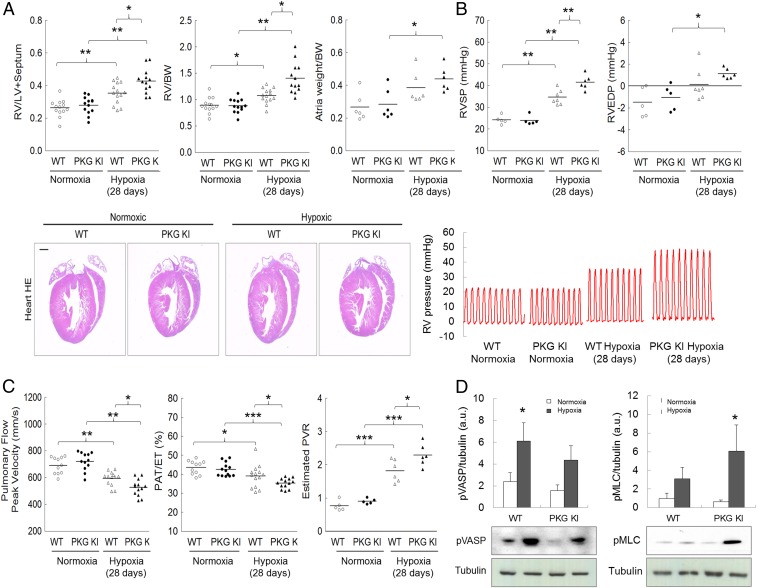
Fig. 4.
“Redox-dead” Cys42Ser PKGIα KI mice subjected to chronic hypoxia develop potentiated PH. (A) RV to LV+S ratio, RV to BW ratio, atria weight to BW ratio, and representative four-chamber view micrographs from hematoxylin eosin staining (H&E) stained heart sections, and (B) RVSP, RV end diastolic pressure (RVEDP), and representative RV pressure tracings from WT or PKG KI mice subjected to either normoxia or chronic hypoxia for 28 d. (C) Changes in pulmonary flow peak velocity, pulmonary acceleration time/pulmonary ejection time (PAT/ET), and estimated PVR in WT or KI mice subjected to either normoxia or chronic hypoxia for 28 d. (D) Phosphorylated MLC (pMLC) and phosphorylated VASP (pVASP) protein expression in lungs from WT or KI mice subjected to either normoxia or chronic hypoxia for 28 d. *P < 0.05, **P < 0.01, ***P < 0.001 versus control or respective WT; n = 12 to 14 per group, or, in some experiments, n = 5 to 7 per group. In some cases, the aspect ratio of the original immunoblots was altered to enable a concise multipanel figure with a consistent presentation style; the original uncropped representative images of these immunoblots are also available in SI Appendix, Fig. S10.

