Fig. 4.
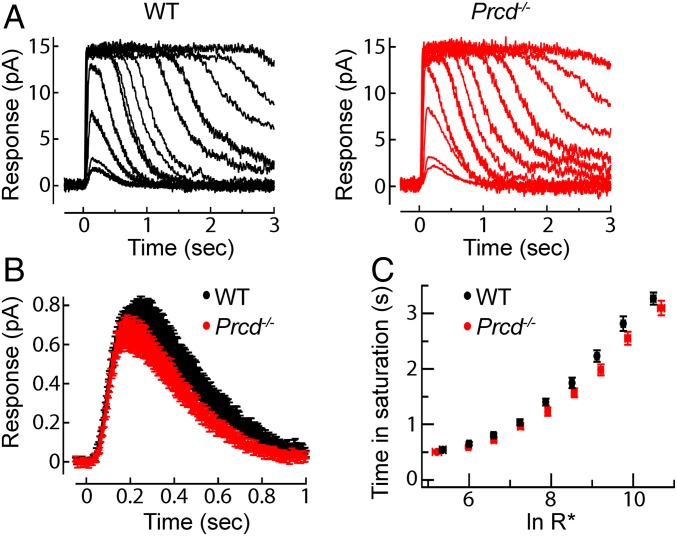
Prcd−/− rods produce normal responses to light. (A) Representative families of flash responses from a WT (black) and Prcd−/− (red) rod. Flash strengths ranged from 4.7 to 74,000 photons µm−2 by factors of 2. (B) Population average single-photon responses from WT (n = 18) and Prcd−/− (n = 18) littermates 40–45 d of age. Average maximal response amplitudes for these populations were 13.2 and 12.2 pA, respectively (P = 0.34). (C) Plot comparing the time that bright flash response remained in saturation as a function of the natural log of the number of photoexcited rhodopsins (R*). Data are shown as mean ± SEM.

