Figure 6.

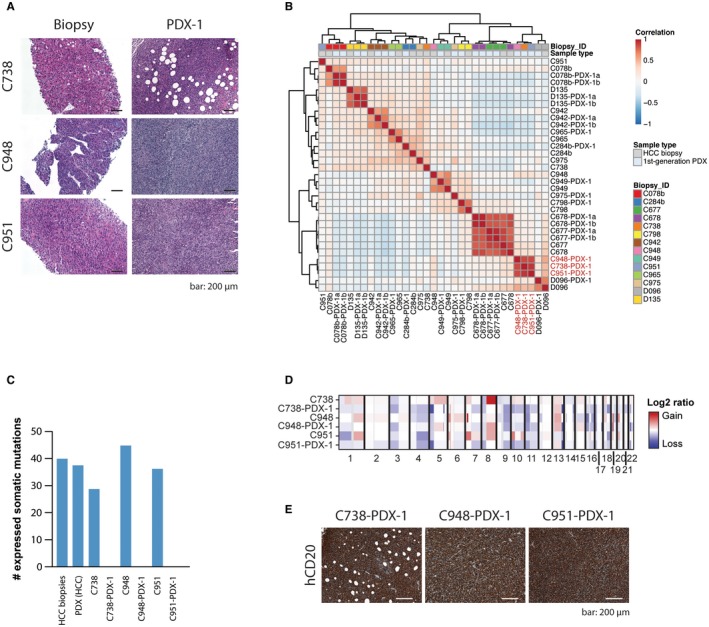
Unintended lymphoid neoplasm transformation in PDX models. (A) H&E‐stained sections of original HCC biopsies and their derivative lymphoma PDX tumors (PDX‐1). (B) Unsupervised clustering of first‐generation PDX and corresponding HCC biopsies. Lymphoma PDX tumors indicated in red. (C) Bar chart illustrating the number of expressed somatic missense and synonymous mutations for the nine HCC biopsies (mean) and the 10 corresponding HCC PDX tumors (mean) and for C738, C948, and C951 and their corresponding lymphoma PDX tumors (C738‐PDX‐1, C948‐PDX‐1, and C951‐PDX‐1). (D) Heatmap of copy number alterations (adjusted segmented log2 ratios) in HCC biopsies and their derivative lymphoma PDX tumors (first generation). Samples are presented in rows and chromosomal positions on the x axis (columns). Red, CNA gains; white, neutral; blue, CNA losses. (E) PDX tumors of the lymphoma models (C738‐PDX‐1, C948‐PDX‐1, and C951‐PDX‐1) stained with hCD20. Scale bar, 200 μm. Abbreviation: hCD20, human CD20.
