Figure 5.

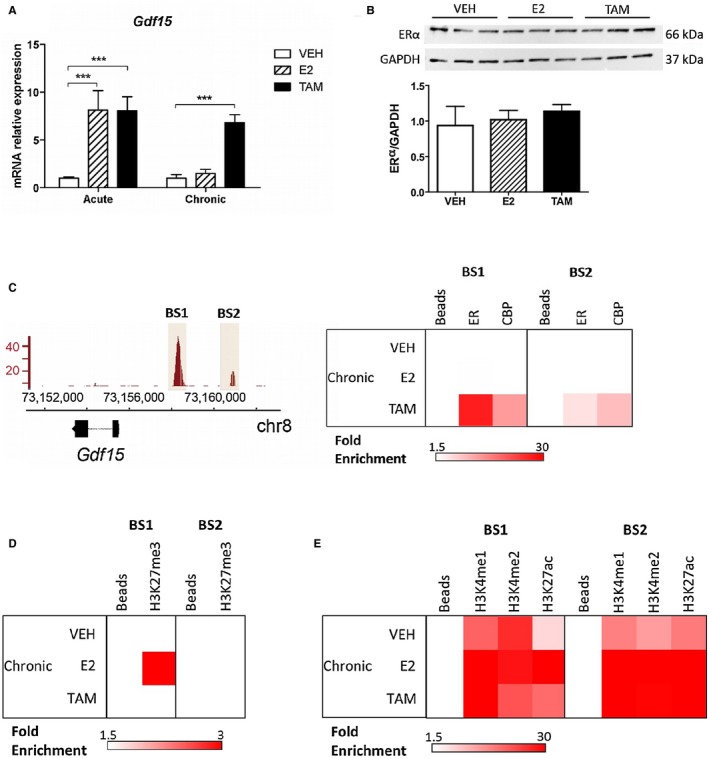
Regulation of Gdf15 expression in the liver with TAM and E2. Ovariectomized female C57Bl/6J mice (n = 12) were treated with TAM, E2, or VEH for 2 hours (acute) or for 3 weeks (chronic). (A) Hepatic Gdf15 mRNA expression was determined by RT‐qPCR in liver tissue samples. Data are expressed as mean ± SEM. ***P < 0.001. (B) Hepatic ERα protein level after chronic treatment was determined by western blot and normalized to Gapdh. (C) ERα enrichment at BS1 and BS2 on the Gdf15 promoter region (left panel) was quantified by ChIP‐qPCR experiments from livers treated as in panel B (right panel). The presence of histone marks (D) H3K27me3 and (E) H3K4me1, H3K4me2, and H3K27ac on BS1 and BS2 were assessed by ChIP‐qPCR experiments on chromatin prepared from the same livers as those used in panel C. Abbreviation: chr, chromosome; Gapdh, glyceraldehyde 3‐phosphate dehydrogenase; RT, reverse transcription.
