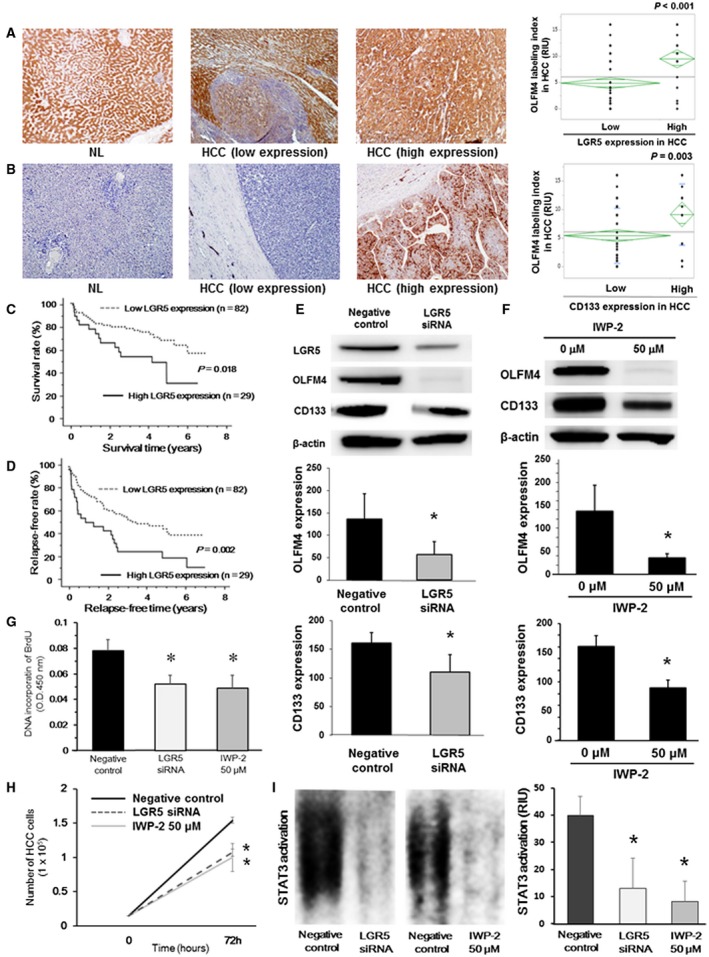
Figure 5.

(A) Immunohistochemical staining for LGR5 in NL tissues from patients with liver metastasis and HCC with high and low LGR5 expression. Results are representative of 111 HCC sections. Original magnification was ×100. The OLFM4 labeling index was significantly higher in HCC with high LGR5 expression (*P < 0.001 between these groups). (B) Immunohistochemical staining for CD133 in NL tissues from patients with liver metastasis and HCC with high and low CD133 expression. Results are representative of 111 HCC sections. Original magnification was ×100. OLFM4 labeling index was significantly higher in HCC with high CD133 expression. *P = 0.003 between these groups. Overall survival (C) and relapse‐free survival (D) of 111 HCC patients in relation to LGR5 expression in HCC were analyzed by the Kaplan‐Meier methods (P = 0.018 and P = 0.002, respectively). (E) Effects of LGR5 knockdown in Huh‐7 cells evaluated by western blotting in vitro (n = 4‐6 per group). *P < 0.001 compared with negative controls. (F) Effects of treatment with the Wnt signaling inhibitor on OLFM4 expression in Huh‐7 cells in vitro (n = 4‐6 per group). Huh‐7 cells were stimulated with 50 μM IWP‐2, a Wnt signaling inhibitor, for 72 hours. *P < 0.001 compared with 0 μM. Effects of LGR5 knockdown or treatment with Wnt signaling inhibitor on DNA incorporation of BrdU (G) and cell proliferation in Huh‐7 cells (H) (n = 4‐6 per group). *P < 0.001 compared with negative controls at 72 hours after incubation. (I) Effects of LGR5 knockdown or treatment with the Wnt signaling inhibitor on STAT3 activation in Huh‐7 cells evaluated by EMSA (n = 4‐6 per group). *P < 0.001 compared with negative controls at 72 hours after incubation. Abbreviation: O.D., optimal density.
