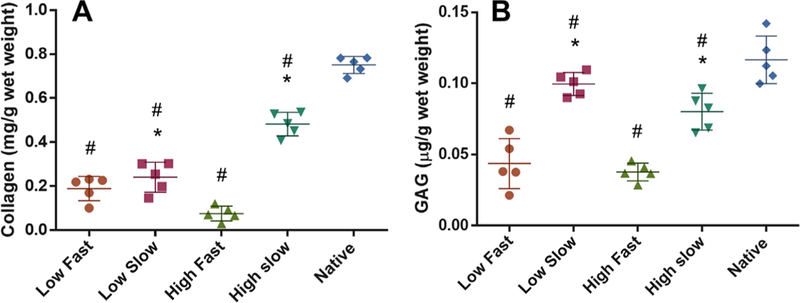
Figure 4.

Collagen (COL) and GAG assays. Total COL contents at the healing region were significantly higher in the high CTGF dose and the slow TGFβ3 release as compared to the low dose and the fast release (A). Total GAG contents at the healing region was significantly higher with the slow TGFβ3 release in comparison with the fast release (B). The low CTGF and the slow TGFβ3 release showed the highest GAG amounts among all the groups (B) (n=5 per group; *p<0.01 compared to the fast; #p<0.01 compared to native). Data represented as mean±standard deviation.
