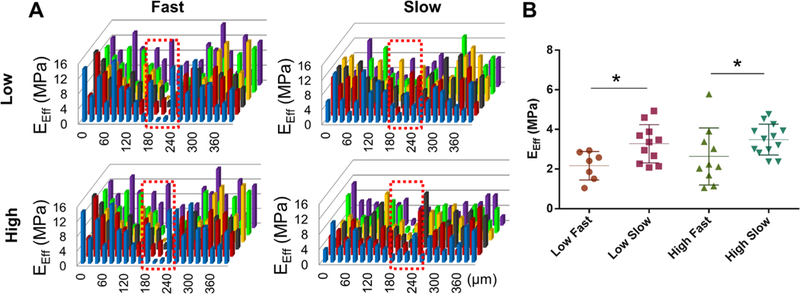
Figure 7.

Modulus mapping with nanoindentation. Distribution of effective indentation modulus (EEff) showed the gap at the healing region (indicated by red dotted box) (A). The average EEff at the healing region was significantly higher with the slow TGFβ3 release rate (B) (n=8–15 per group; *p <0.001). Data represented as mean±standard deviation.
