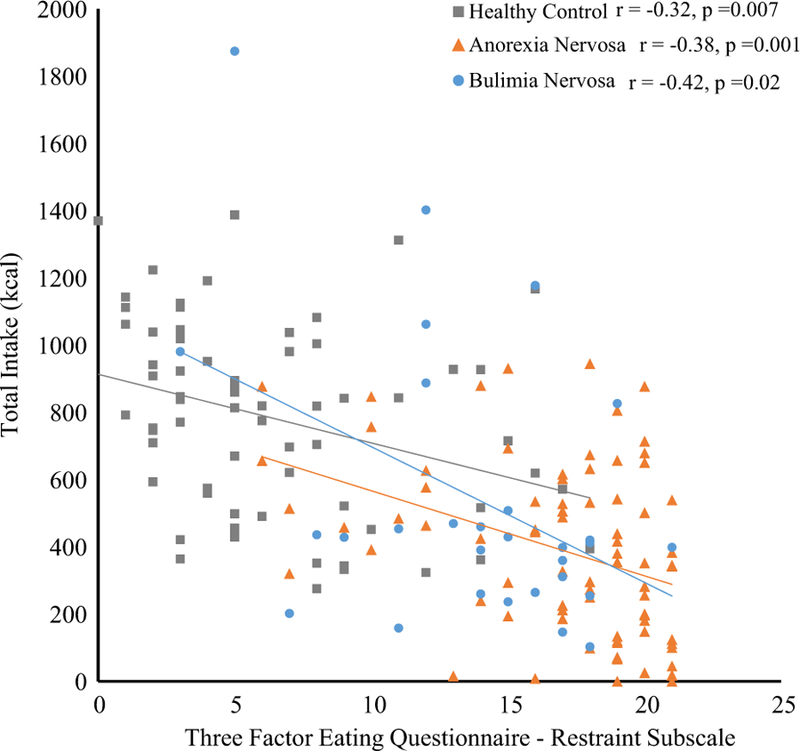
FIGURE 1.

Pearson’s correlation between TFEQ Restraint subscale and caloric intake in the laboratory meal, with binge meals excluded. The association is statistically significant across the total sample (r = −0.598, p < 0.001) and within each diagnostic group, as shown [Color figure can be viewed at wileyonlinelibrary.com]
