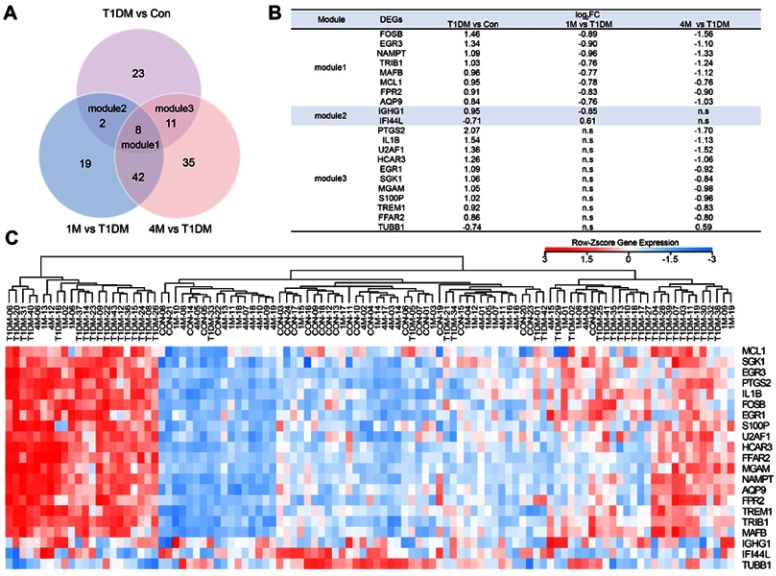
Figure 3.
Classification of DEGs in T1DM and insulin-treated patients. (A) Venn diagram showing the DEGs in different groups. (B) DEGs in modules 1–3. (C) Heatmap of DEGs in modules 1–3. Red indicates upregulation and blue indicates downregulation.
Abbreviations: T1DM, type 1 diabetes mellitus; Con, control; DEG, differentially expressed gene; 1M, 1 month; 4M, 4 months; ns, not significant.

