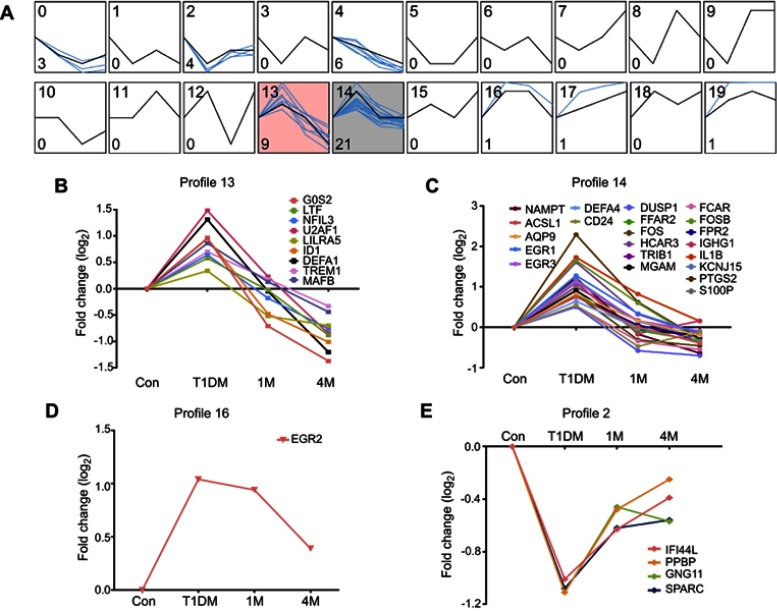
Figure 4.
Dynamic expression patterns of DEGs in different periods of T1DM treatment. (A) Dynamic expression profiles of DEGs determined by STEM. The black lines in the boxes represent model expression profiles. The blue lines indicate the individual gene expression change ratios over different periods. The number in the top left corner is the profile ID, and the number in the bottom left corner is the gene number of this profile. The colored profiles (13 and 14) indicate that a statistically significant number of genes was assigned to the model expression profile. (B–E) Classified gene expression trends in meaningful profiles were present in different periods.
Abbreviations: DEG, differentially expressed gene; STEM, Short Time-series Expression Miner; Con, control; T1DM, type 1 diabetes mellitus; 1M, 1 month; 4M, 4 months.

