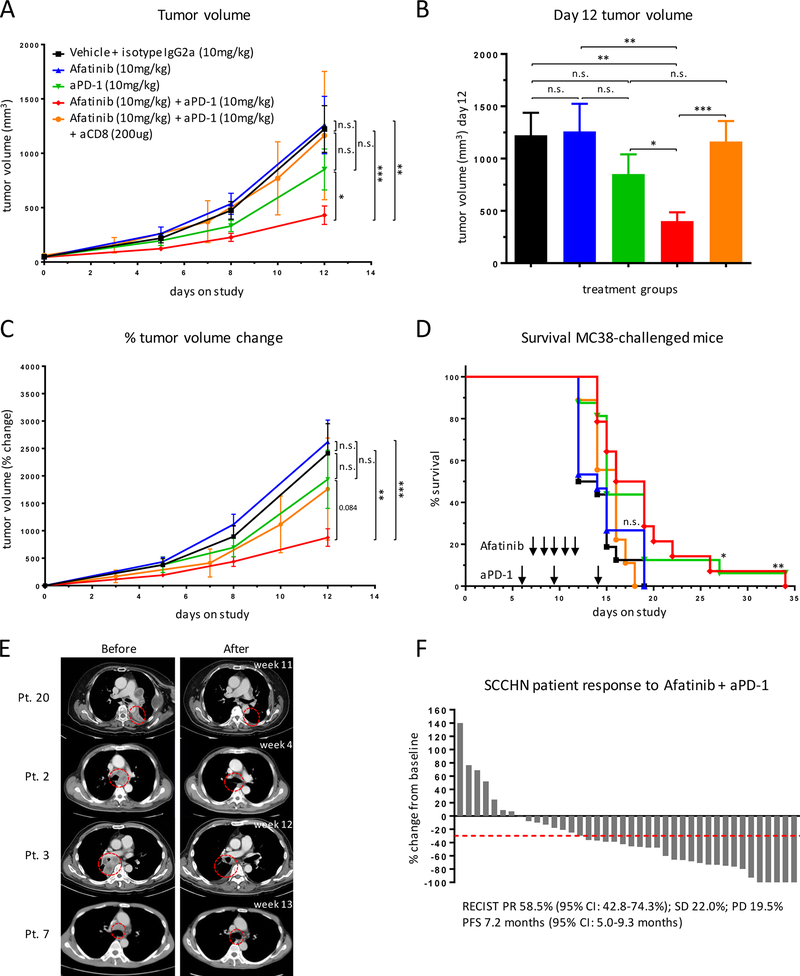
Figure 7: EGFR inhibition enhances efficacy of PD-1 blockade.
C57BL/6J mice (15–16 mice/group) were challenged subcutaneously with 500,000 MC38 colon cancer cells on their flanks and enrolled on-study when tumors reached 50 mm3. Mice were treated with anti-PD-1 on days 5, 8, and 12 and afatinib on days 6, 7, 8, 9, and 10 (where indicated). (A) Tumor volume of enrolled mice treated with the indicated combinations. (B) Tumor volume at day 12 of the study. (C) Tumor growth kinetics. (D) Survival of mice with the indicated treatments. For survival curves: vehicle vs. afatinib n.s.; vehicle vs. anti–PD-1 p=0.013; vehicle vs. combo p=0.003; afatinib vs. anti–PD-1 p=0.069; afatinib vs. combo p=0.017; anti–PD-1 vs. combo n.s.; vehicle vs. combo CD8-depleted n.s.; afatinib vs. combo CD8-depleted n.s.; anti–PD-1 vs. combo CD8-depleted p=0.071; combo vs. combo CD8-depleted p=0.028. (E,F) Response to afatinib and pembrolizumab combination therapy in retrospective cohort of patients with SCCHN. Data presented as (E) pre- and post-treatment scans of selected responders and (F) waterfall plot of % tumor volume change from baseline in response to treatment. Flank tumor growth curves were analyzed using two-way ANOVA, bar graphs were analyzed using unpaired Student’s t-test, and survival experiments used the log-rank Mantel-Cox test for survival analysis. All indicated with *p<0.05, **p<0.01, ***p<0.001.

