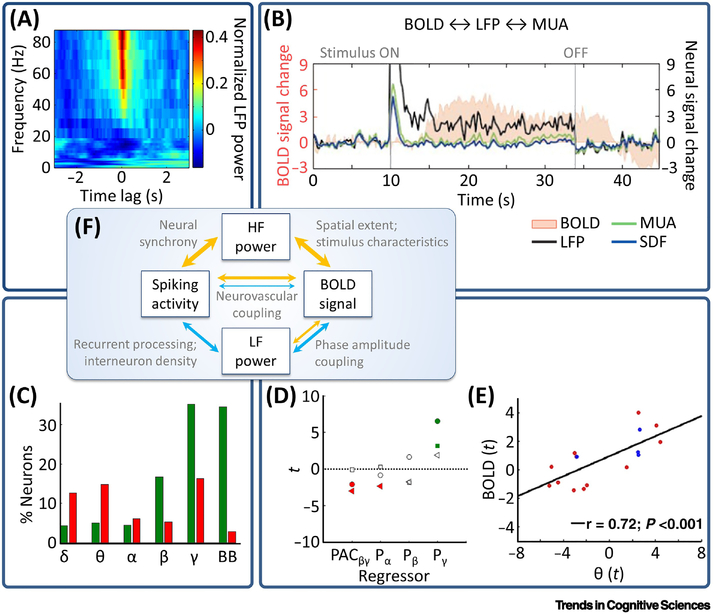
Figure 2. Relationships between spiking activity, LFPs, and BOLD.
(A) Spike-triggered average time-frequency power plot showing that spiking activity is accompanied by increases in high-frequency (“HF”) and decreases in low-frequency (“LF”) power (adapted from [79]). Power is normalized across time. (B) Close relationship between the (delayed) BOLD response and LFP high-frequency power, and weaker relationship between BOLD and multi-unit activity (MUA): Whereas MUA shows a transient response, BOLD and LFPs exhibit a sustained response throughout stimulus presentation. SDF, spike-density function (adapted from [98]). (C) Spiking activity (in widespread regions including frontal, parietal, and occipital cortices, amygdala, hippocampus, and the parahippocampal region) is positively related to broadband (“BB”) and high-frequency (gamma) power, but negatively related to low-frequency (delta, theta) power. Green/red bars, percentage of neurons showing a positive/negative relationship between spiking activity and LFP power (adapted from [78]). (D) While beta-gamma phase-amplitude coupling (PAC) and alpha power are negative BOLD predictors, gamma power relates positively to BOLD (adapted from [104]). Red, significantly negative; green, significantly positive. Each marker, one patient. (E) Positive relationship between theta power and parahippocampal BOLD signal (adapted from [83]). (F) Highly simplified model of the relationship between spiking activity, LFP power, and the BOLD signal. Orange arrows, positive relationships; light blue arrows, negative relationships. Thicker lines indicate stronger evidence. Deviations from this model can arise due to various modulating factors (see text annotations for non-exhaustive examples and the main text for details).

