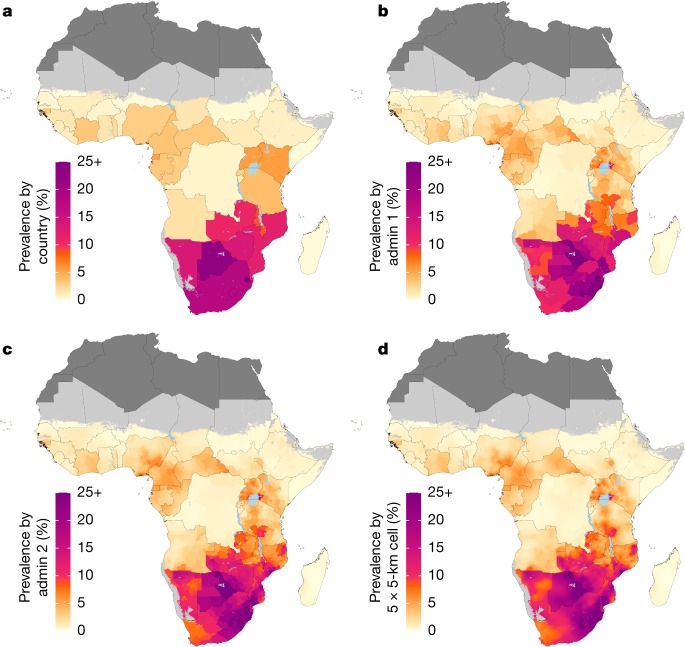
Fig. 1. Prevalence of HIV in adults aged 15–49 in 2017.
a–d, Prevalence of HIV among adults aged 15–49 in 2017 at the country level (a), first administrative subdivision level (admin 1; b), second administrative subdivision level (admin 2; c) and 5 × 5-km grid-cell level (d). Maps reflect administrative boundaries, land cover, lakes and population; grid cells with fewer than 10 people per 1 × 1 km, and classified as barren or sparsely vegetated, are coloured light grey25,26,37–40. Countries in dark grey were not included in the analysis.

