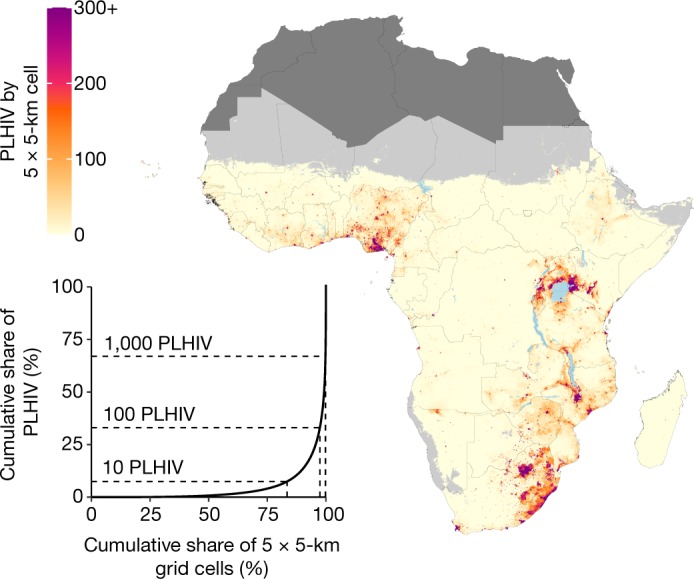
Fig. 3. Number of people living with HIV for adults aged 15–49 in 2017.

Number of people living with HIV (PLHIV) aged 15–49 in 2017 per 5 × 5-km grid cell (map) and Lorenz curve depicting the cumulative share of people living with HIV compared to the cumulative share of 5 × 5-km grid cells (inset). Maps reflect administrative boundaries, land cover, lakes and population; grid cells with fewer than 10 people per 1 × 1 km, and classified as barren or sparsely vegetated, are coloured light grey25,26,37–40. Countries coloured dark grey were not included in the analysis. In the inset, dotted lines indicate the cumulative share of people living with HIV and cumulative share of 5 × 5-km grid cells represented by grid cells with fewer than 10, 100 and 1,000 people living with HIV each.
