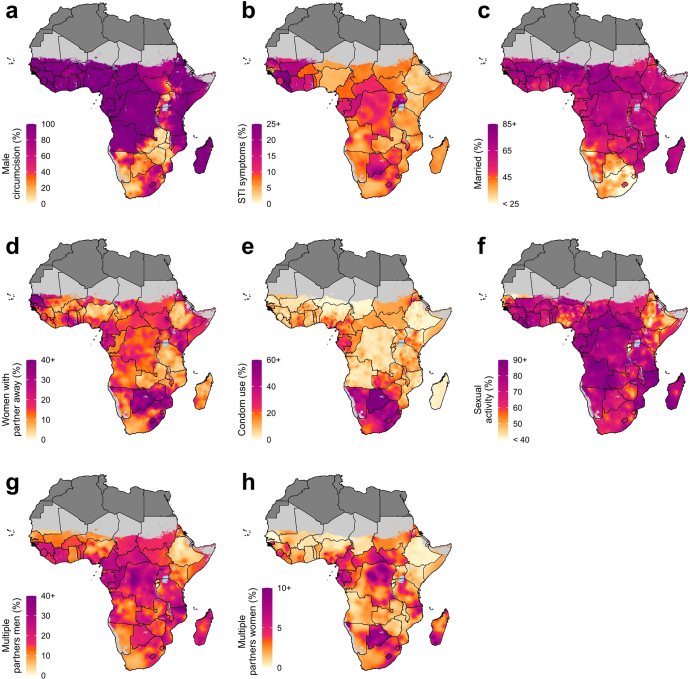
Extended Data Fig. 6. Prevalence of covariates at 5 × 5-km grid cell level in 2017.
a–h, Maps of HIV-specific covariates in 2017 include prevalence of male circumcision (a), prevalence of signs and symptoms of sexually transmitted infections (b), prevalence of marriage or living as married (c), prevalence of partner living elsewhere among women (d), prevalence of condom use during the most recent sexual encounter (e), prevalence of sexual activity among young women (f), prevalence of multiple partners among men in the past year (g) and prevalence of multiple partners among women in the past year (h). Maps reflect administrative boundaries, land cover, lakes and population; grid cells with fewer than 10 people per 1 × 1 km, and classified as barren or sparsely vegetated, are coloured light grey25,26,37–40. Countries in dark grey were not included in the analysis.

