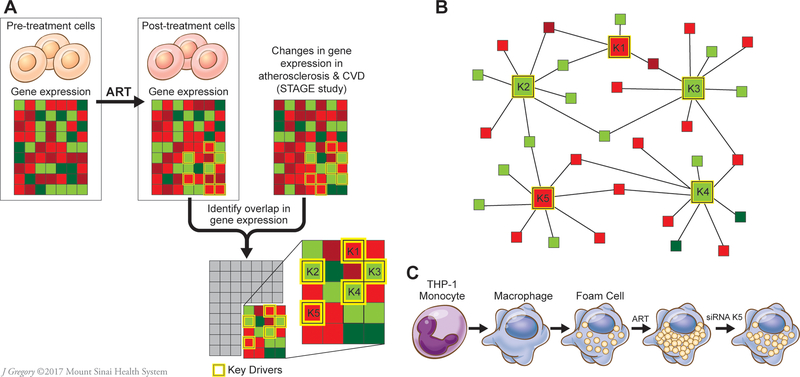
Figure 2.
Schematic flow of analytic and experimental validation steps. A. Genes differentially expressed in response to 15 antiretroviral therapy (ART) drugs were identified in the LINCS database. Their enrichments and co-expression were then sought in 30 regulatory gene networks (RGNs) identified in the STAGE study as coronary artery disease (CAD)-causal.22 Genes most essential for the activity of RGNs, or key drivers (K1-K5) were also included in this analysis. B. A schematic example of a RGN with 5 key disease drivers. C. Experimental validation of atherosclerosis-related RGN (AR-RGN) enriched in ART signatures using an atherosclerosis model in vitro. THP-1 monocytes were differentiated into THP-1 macrophages in vitro and then incubated with AcLDL and individual ART drugs to form THP-1 foam cells. To assess the role of key driver genes in AR-RGN in foam cell formation induced by ART drugs, THP-1 macrophages were subjected to key driver silencing. CVD, cardiovascular disease. STAGE, the Stockholm Atherosclerosis Gene Expression study.22 Red color exemplifies downregulated genes, green color upregulated genes.

