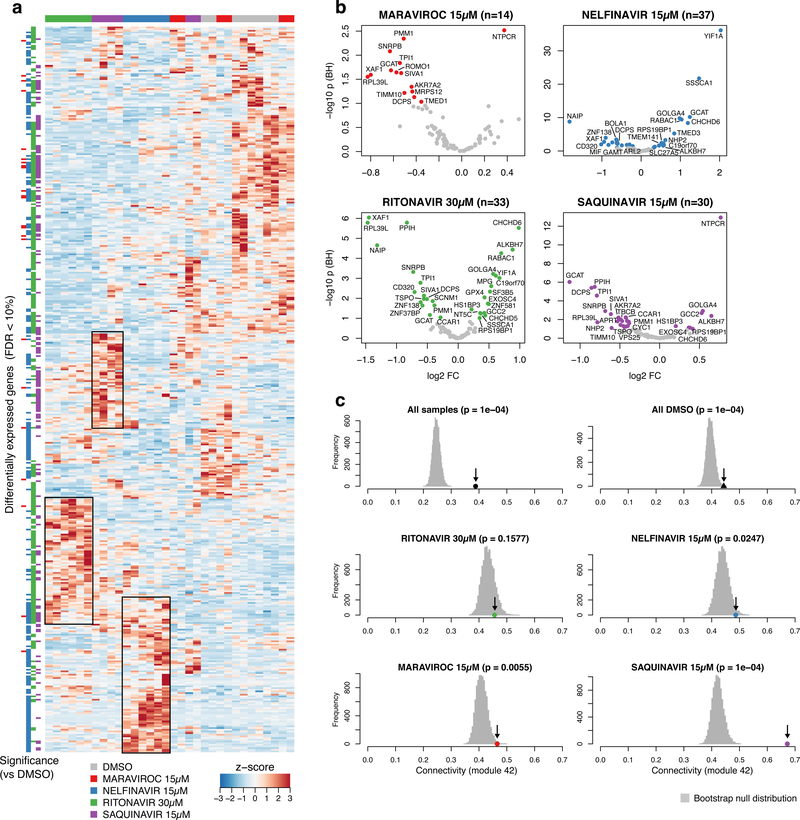
Figure 6.
Effects of antiretroviral (ART) drugs on gene expression in THP-1 foam cells. A. Heat map of all differentially expressed genes comparing treatments with DMSO versus ritonavir, nelfinavir, saquinavir and maraviroc, respectively, in THP-1 foam cells incubated with acetylated LDL. B. Volcano plots showing differentially expressed AR-RGN genes in THP-1 foam cells following ART drug treatments. C. Permutation test showing the mean connectivity (r, Pearson correlations, x-axis) of atherosclerosis-related regulatory gene network (AR-RGN) genes (arrow) compared to the null distribution of 1,000 random equally sized sets of genes in THP-1 foam cells following ART drug treatments (color code indicates each ART drug).

