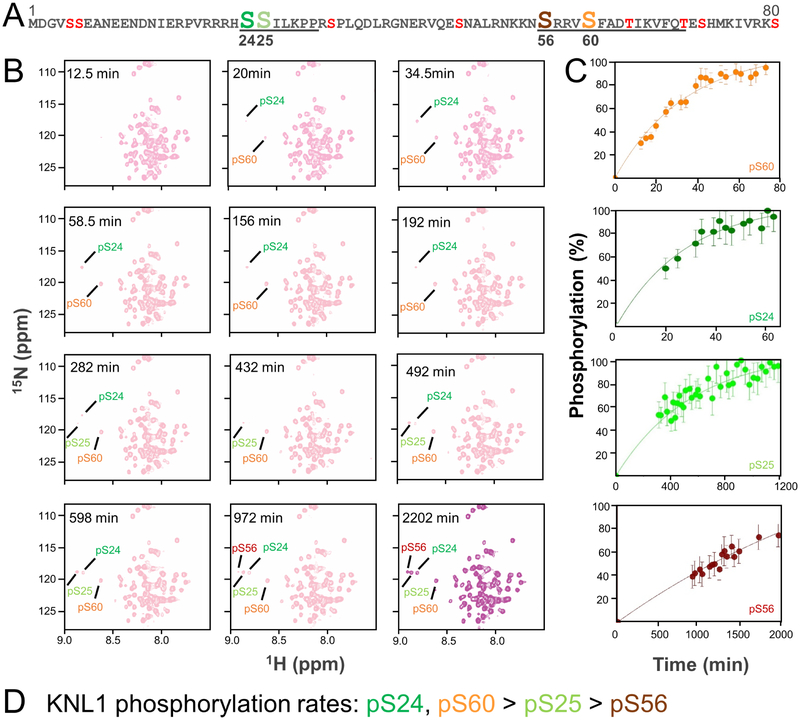
Figure 3: Real-time NMR monitoring of the phosphorylation of KNL1–80.
(A) Sequence of WT-KNL11–80 with the potential phosphorylation sites indicated; the residues that bind directly to PP1 are underlined. The four residues phosphorylated directly by Aurora B kinase, as observed using NMR spectroscopy, are indicated (Ser24, Ser25, Ser56 and Ser60).
(B) 2D [1H15N] HSQC spectra of KNL11–80 after the addition of Aurora B kinase. The N-HN cross peaks of the phosphorylated serines are labeled.
(C) Build-up curves showing the time-course of phosphorylation of KNL11–80 by Aurora B Kinase.
(D) KNL1 phosphorylation rates in descending order.

