Figure 5.
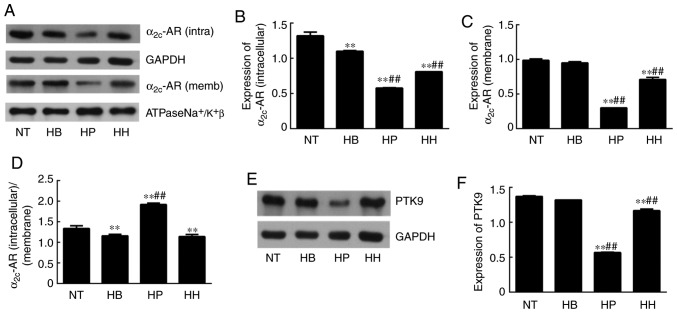
Effect of higenamine on α2C-AR and PTK9 signaling pathways in hypothermic human dermal microvascular endothelial cells. (A) Representative band images obtained from western blot analysis of the expression of intracellular and membrane α2C-AR. Densitometry analysis of (B) intracellular and (C) membrane α2C-AR. (D) Evaluation of the α2C-AR (intracellular)/α2C-AR (membrane) ratio. (E) Western blot analysis and (F) densitometry of PTK9 expression. Statistical analysis was performed using the one-way analysis of variance followed by Dunnett's test analysis. **P<0.01 vs. the NT group. ##P<0.01 vs. the HB group. HH, hypothermia+higenamine; HP, hypothermia+Positive control drug; HB, hypothermia; NT, Normal temperature; AR, adrenoreceptor; PTK9, twinfilin-1.

