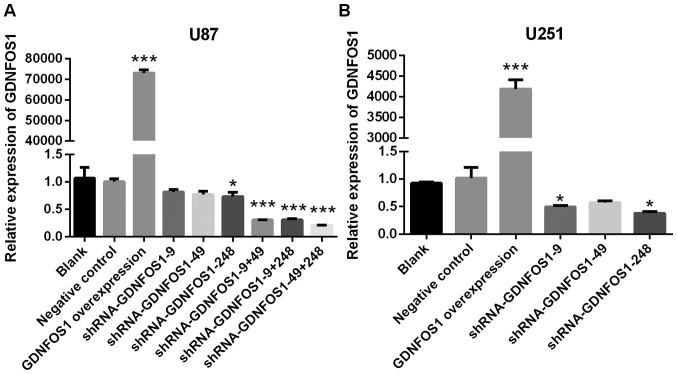
Figure 1.
Confirmation of the overexpression and interference of GDNFOS1 in U87 and U251 MG cells. Reverse transcription quantitative PCR analysis of GDNFOS1 mRNA expression in (A) U87 MG cells and (B) U251 MG cells. Data are presented as the mean ± standard deviation of three measurements per group. *P<0.05 and ***P<0.001 vs. negative control group. GDNFOS1, glial cell line-derived neurotrophic factor OS1; shRNA, short hairpin RNA.

