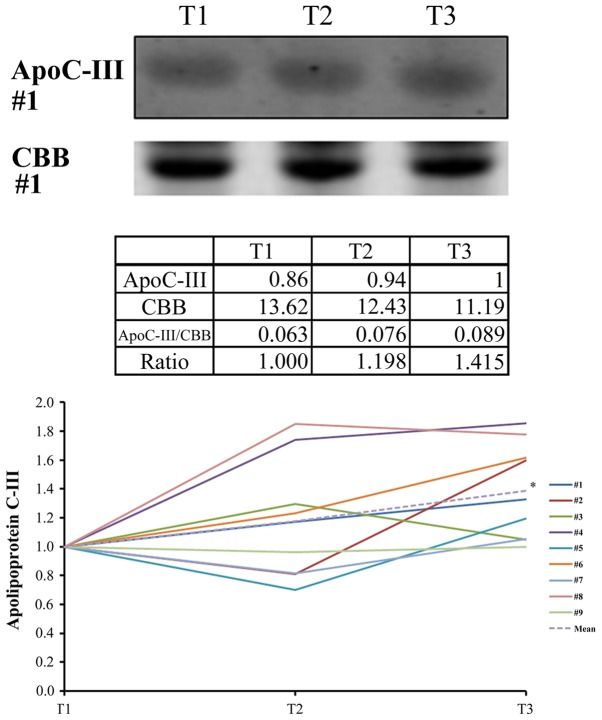
Figure 4.
Representative images and relative intensities from the western blot analysis of ApoC3. As an internal loading control, non-specific proteins stained with CBB are shown in the lower panel. Data from triplicate experiments were analyzed to calculate the average values. *P=0.046 between T1 and T3 using the paired t-test with post-hoc analysis using the Bonferroni method. ApoC3, apolipoprotein C3; CBB, Coomassie Brilliant Blue; T1, prior to cooling; T2, prior to rewarming; T3, immediately after rewarming.

