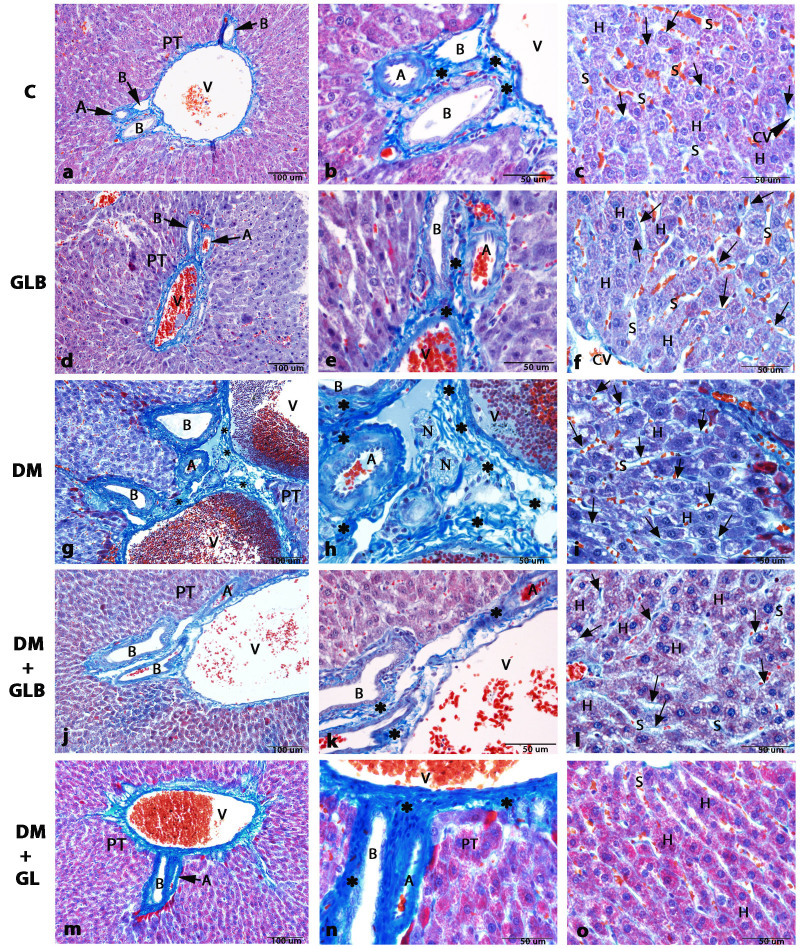
Figure 2.
Photomicrographs of histological structure of liver tissue in rats by Masson's trichrome staining. (A, B, and C) Control and (D, E and F) GLB tissue exhibited a normal PT cellular architecture, consisting of V, A and B. A and D (magnification, ×20). (B and E) Micrographs in the area of PT showing the normal collagen fiber deposition (magnification, ×60). (C and F) H arrangement resembled that of a sponge with sinusoids presented by the S in the direction of the center, where they drained into the CV. Collagen fibers are stained very light blue (arrows) around the boundary of H (magnification, ×60). (G) The DM group exhibited collagen fiber deposition which was increased at the area of PT (magnification, ×20). (H) Micrograph in the area of PT illustrating the abundant of collagen fiber deposition (magnification, ×60). (I) Collagen fibers deposition also increases in the area around the boundary of H along the sinusoids (magnification, ×60). The DM+GLB (J, K and L) and DM+GL groups (M, N and O) respectively illustrating the area of PT, which is similar to control and GLB rats (magnification, ×20). (K and N) Micrographs in the area of PT in high magnification (magnification, ×60). (L and O) Liver tissue exhibits normal collagen fiber deposition stained very light blue (arrows) around the boundary of H. (magnification, ×60). *indicates collagen fiber deposition. PT, portal triad; V, portal venule; A, arteriole; B, bile duct; H, hepatocyte; CV, central vein; S, sinusoids; N, nerve bundles; DM, diabetes mellitus; GLB, glabridin; GL, glibenclamide; H, hepatocyte; CV, central vein.

