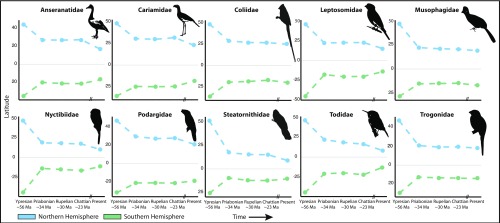
Fig. 3.
Temporal shifts in the centroid of suitable habitat for each clade. Binary suitability maps were converted to polygons and used to find the “center of mass” for areas presenting suitable conditions in each time slice; Northern (blue) and Southern (green) Hemispheres were calculated separately. Results are shown for the least training presence (LTP) threshold; see SI Appendix, Fig. S31 for MaxSSS threshold results.

