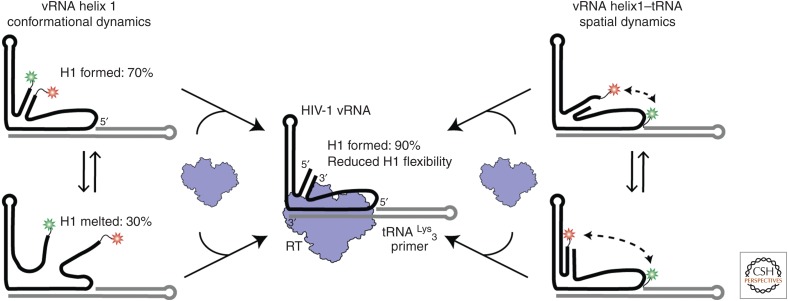
Figure 4.
The conformational heterogeneity observed in the vRNA–tRNA complex is reduced on the introduction of reverse transcriptase (RT). (Left) Viral RNA helix 1 (vRNA H1) formation was monitored in the absence and presence of RT by labeling the vRNA on its 3′ and 5′ ends. Two main populations were observed. (Right) The spatial orientation of H1 and the tRNA was monitored by labeling vRNA H1 and the 5′ end of the tRNA. A variety of interconverting high and low FRET populations were observed, indicating conformational dynamics. (Center) Upon RT binding, we observed a reduction in the conformational and structural heterogeneity for vRNA H1. FRET populations shifted to indicate 90% H1 formation and the FRET populations for the vRNA–tRNA dynamics shifted to all low FRET states. (Data adapted from Coey et al. 2018.)

