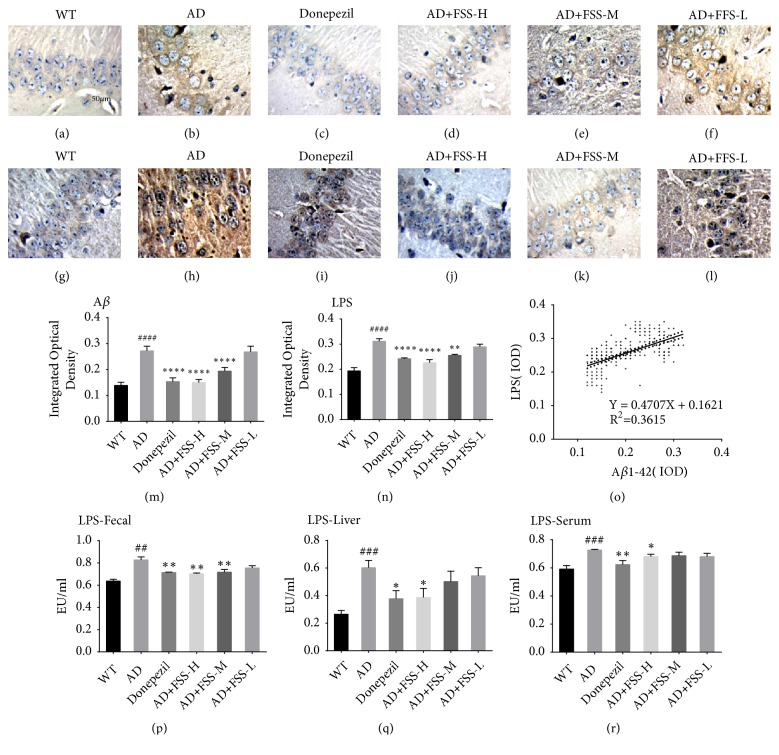
Figure 3.
FSS attenuates Aβ1-42 and LPS in the gut, liver, serum, and brain of APP/PS1 AD mice. (a–l) Mouse hippocampal CA1 regions were observed at 400× magnification after immunohistochemical staining. (a–f) Expression levels of Aβ1-42. (g–l) Expression levels of LPS. (m, n) Graphs of the IOD of Aβ1-42 and LPS, respectively. (o) Correlation analysis between the IOD of Aβ1-42 and LPS. (p, q, r) Levels of LPS in the fecal matter, liver, and serum, respectively. Five photographs were taken of each area. IPP6.0 Pathology Image software was used to determine the IOD in each set of images, which was taken as the IOD value of the sample. Data represent the mean ± SEM (n = 8 per group). # P < 0.05, ## P < 0.01, ### P < 0.001 compared with WT. ∗ P < 0.05, ∗∗ P < 0.01, ∗∗∗ P < 0.001, compared with AD. FSS: Fo Shou San; AD: Alzheimer's disease; WT: wild type; FSS-L: 1.6 g/kg/day; FSS-M: 3.2 g/kg/day; FSS-H: 6.4 g/kg/day; Aβ1-42: amyloid-β; LPS: lipopolysaccharide; IOD, integrated optical density.

