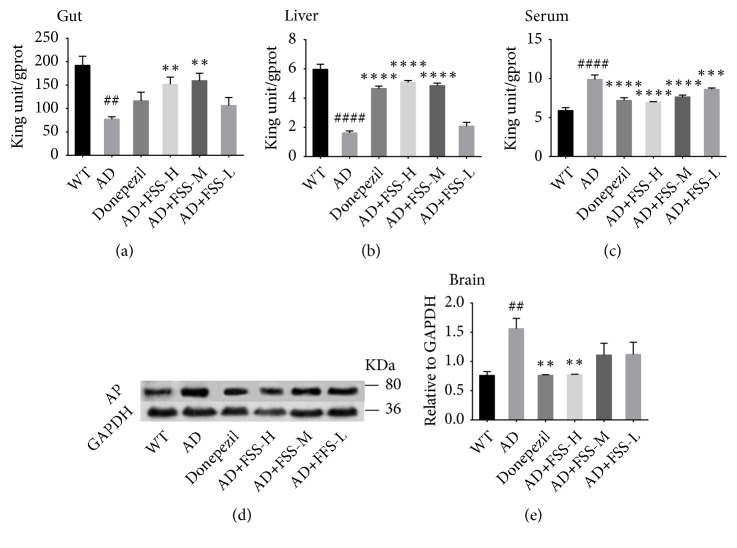
Figure 4.
FSS regulates expression and activity of AP in the gut, liver, serum, and brain of APP/PS1 AD mice. (a) Quantification of AP in the gut (n = 7 per group). (b) Quantification of AP in the liver (except WT group, n = 9; n = 8 per group). (c) Quantification of AP in the serum (except WT and AD group, n = 7; n = 6 per group). (d) Expression of AP protein from hippocampus tissue (n = 3) detected by western blot analysis and quantified in (e) compared with expression of GAPDH (36 kDa) as the control. Data represent the mean ± SEM. ## p < 0.05 and ### p < 0.001 compared with WT. ∗ P < 0.05, ∗∗ P < 0.01, and ∗∗∗ P < 0.001 compared with AD. FSS: Fo Shou San; AD: Alzheimer's disease; WT: wild type; FSS-L: 1.6 g/kg/day; FSS-M: 3.2 g/kg/day; FSS-H: 6.4 g/kg/day; AP: alkaline phosphatase.

