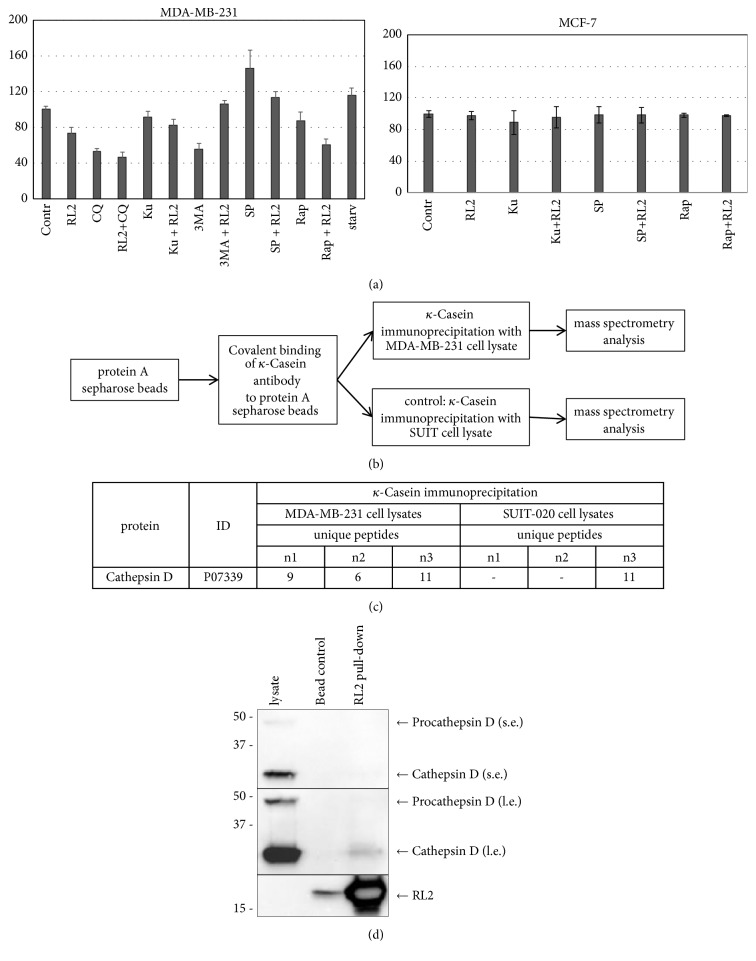
Figure 7.
Cathepsin D effects. (a) Changes in CatD activity. MDA-MB-231 and MCF-7 cells were treated with RL2 (0.2 mg/mL), CQ (5μM), Ku (30 μM), 3MA (15 mM), spermidine (6 μM), and Rap (15 μM) for 24 h, and after that CatD activity in lysates was measured using fluorescent substrate. Starvation (starv) was initiated by serum deprivation. The data are presented as percentage from control (nontreated cells) and shown as the mean ± SD of three independent experiments. (b) Workflow for RL2-based mass spectrometry analysis. κ-Casein antibody protein A sepharose beads were loaded with κ-Casein antibody and incubated with RL2-treated MDA-MB-231 cell lysates or RL2-treated SUIT-020 cell lysates (control). Precipitated proteins were identified by nano-LC-tandem mass spectrometry. (c) Mass spectrometry identified unique peptides for each protein in the course of identification. The absolute values of unique peptides for Cathepsin D identified by mass spectrometry analysis are shown here. The abbreviations n1, n2, and n3 indicate absolute values for every experimental replicate. (d) RL2-pull-down precipitates were analyzed by Western Blot and probed for indicated proteins (bead con: control IP without antibody).

