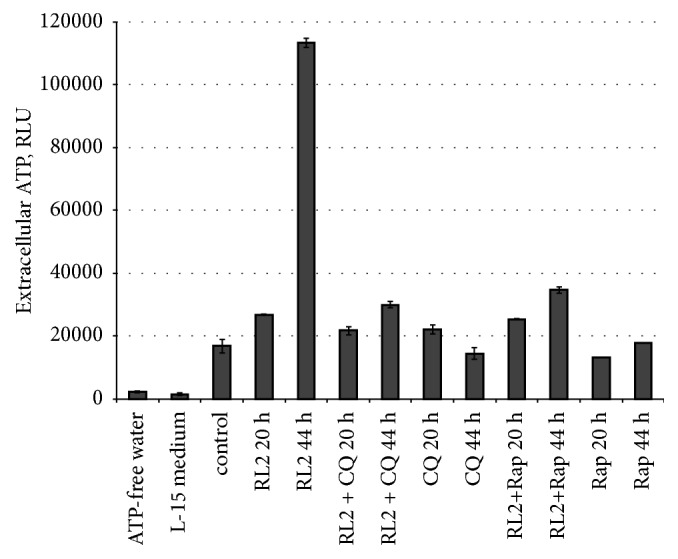
Figure 8.

Analysis of drug-related ATP release. MDA-MB-231 cells were treated with RL2 (0.2 mg/mL), CQ (5μM), and Rap (15 μM) for 20 or 44 h; after that medium was collected and tested with ATP-specific luminescent substrate. RLU: relative luminescence units. The data are representative of three independent repeats and are shown as the mean ± SD.
