Figure 1.

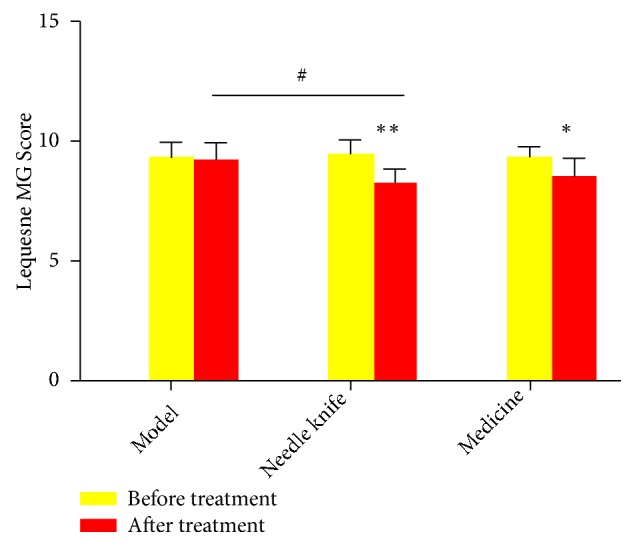
Evaluation of knee joint activity in each group by using Lequesne MG scores. ∗P < 0.05, ∗∗P < 0.01 compared with the same group before treatment; #P < 0.05, ##P < 0.01 compared with the model group after treatment.

Evaluation of knee joint activity in each group by using Lequesne MG scores. ∗P < 0.05, ∗∗P < 0.01 compared with the same group before treatment; #P < 0.05, ##P < 0.01 compared with the model group after treatment.