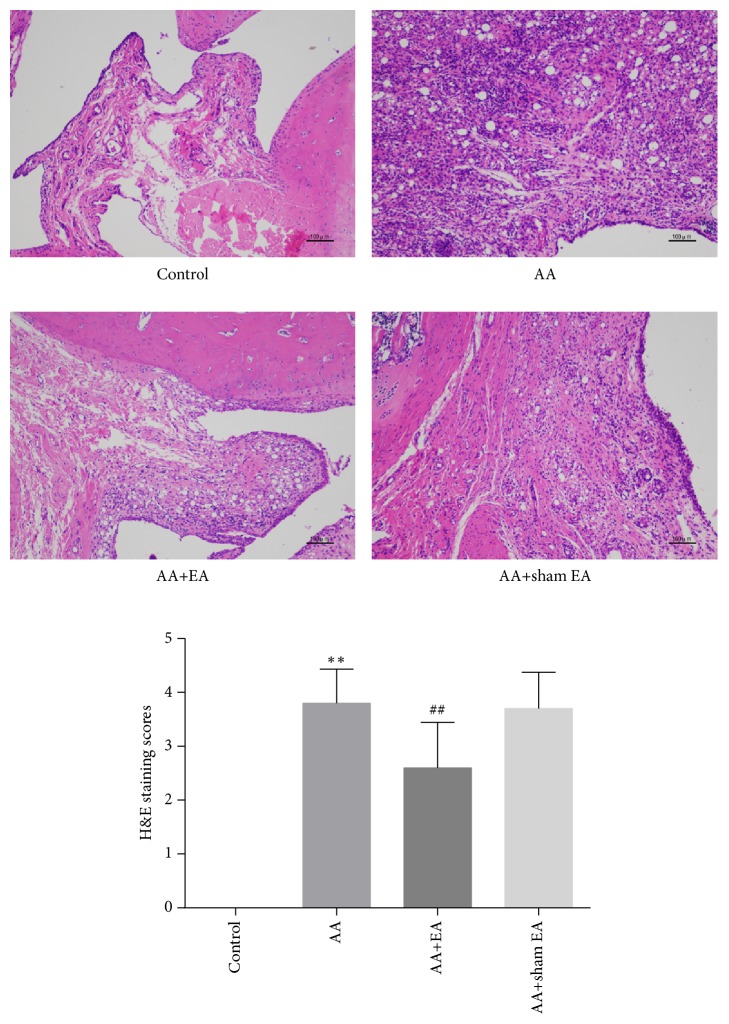
Figure 3.
Inflammation in synovial tissue of the ankle joint. Representative H&E-stained sections from the control group, demonstrating no evidence of inflammation in the ankle joint, the AA group and the AA+sham EA group illustrating massive inflammatory infiltration, synovial proliferation, and angiogenesis in the swollen joints, and the AA+EA group, demonstrating less inflammatory cell infiltration, synovial proliferation and angiogenesis in the ankle joint (n=10) (×100). Data are means±SD. ∗P <0.05; ∗∗P <0.01, compared with the AA group. #P <0.05; ##P <0.01, compared with control group.

