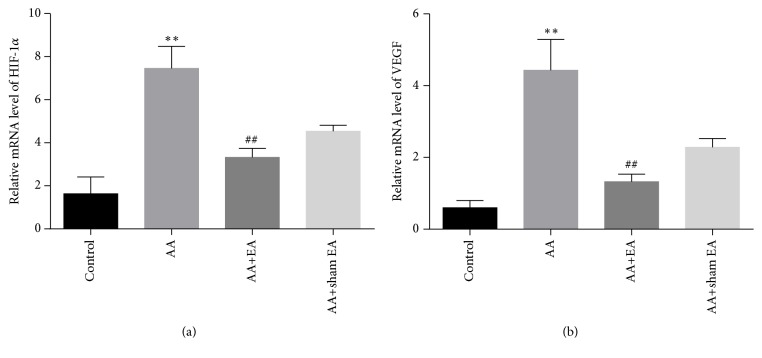
Figure 5.
HIF-1α and VEGF mRNA expression in synovial tissue. Measurement of synovial HIF-1α and VEGF mRNA abundance by real-time quantitative-PCR analysis. (a) Summary of EA on expression of HIF-1α mRNA. (b) Summary of EA on expression of VEGF mRNA. Data are shown as mean ± SD, n=10. Compared with control group, ∗P < 0.05 and ∗∗P < 0.01; compared with AA group, #P < 0.05 and ##P <0.01 (n=10).

