Figure 5.
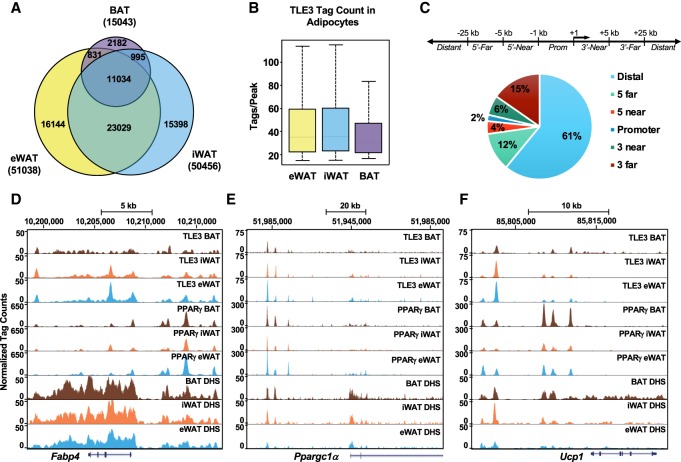
Genome-wide profiling of TLE3 in adipocytes reveals increased binding in WAT. (A) Venn diagram demonstrating the number of TLE3-binding sites in eWAT, iWAT, and BAT, filtered for >15 tags and >10-fold above input. (B) Binding intensity at sites occupied by TLE3 in differentiated adipocytes from eWAT, iWAT, and BAT. (C) Genomic distribution of TLE3 relative to the distance from transcriptional start sites (TSSs). (D) Genome browser tracks of Fabp4 for TLE3 and PPARγ in eWAT, iWAT, and BAT. (E) Genome browser tracks of Ppargc1α for TLE3 and PPARγ in eWAT, iWAT, and BAT. (F) Genome browser tracks of Ucp1 for TLE3 and PPARγ in eWAT, iWAT, and BAT.

