Figure 3.
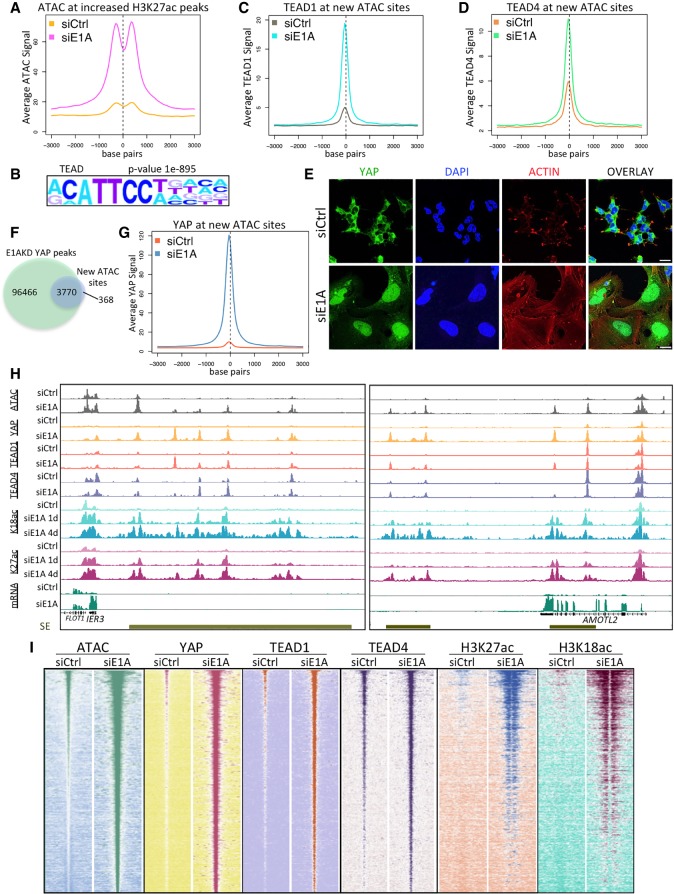
Chromatin modification and YAP association with TEAD TFs in E1AKD293 cells. (A) Average ATAC-seq signal centered at H3K27ac peaks that increased more than fivefold after 4 d of E1AKD. (B) Sequence motif analysis (HOMER) showing the most significantly enriched TF motif at all ATAC-seq peaks that increased more than fivefold following E1AKD. (C,D) Average TEAD1 (C) and TEAD4 (D) ChIP-seq signal centered at ATAC-seq peaks that increased more than fivefold following 4 d of E1AKD. (E) Confocal microscopy of 4-d siRNA transfected HEK293 cells fixed and immunostained with anti-YAP (DH81X) and stained with phalloidin-iFluor and DAPI. Scale bars, 20 µm. (F) Venn diagram displaying the number of overlapping or nonoverlapping ATAC-seq and YAP ChIP-seq peaks. (G) Average YAP ChIP-seq signal centered at ATAC-seq peaks that increased more then fivefold following 4 d of E1AKD. (H) Genome browser plots (Integrated Genome Browser) displaying the indicated ChIP-seq, ATAC-seq, and mRNA-seq signal at superenhancers (SE; gold bars) near E1AKD-activated genes IER3 and AMOTL2. (I) Heat maps representing relative ATAC-seq or ChIP-seq read density centered at every E1AKD-induced ATAC-seq peak (increased more than fivefold compared with siCtrl) from siRNA transfected HEK293 cells. Peaks are sorted by sum of ATAC-seq peak signal in siE1A. Base pair span is ±3 kb from the center of the peak.

