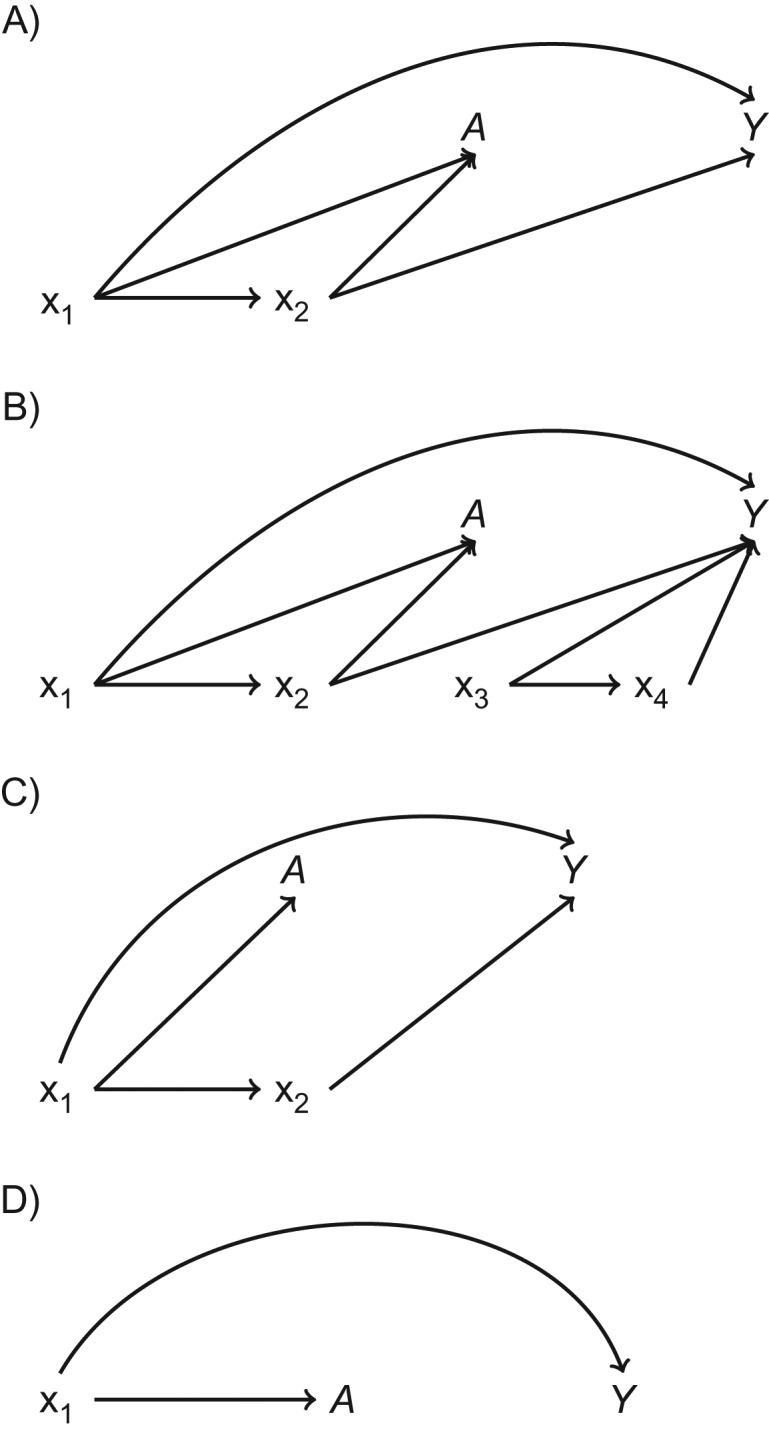
Figure 2.

Directed acyclic graphs of data structures simulated to evaluate the performance of matching methods as compared with unmatched ordinary least squares regression. We simulated 9 distinct data structures that are represented by 4 directed acyclic graphs. A) “Confounder-outcome linear” data structures (data structures 1 and 2). B) “Confounder-outcome quadratic” data structures (data structures 3 and 4); we added the covariates x3 and x4 and dramatically increased the amount of random error (multiplied the error by 100; see Web Appendix and Web Figure 1B for data-generating equations) in order to evaluate the comparative performance of the methods when much of the variability in the outcome was not due to the confounders x1 and x2. C) Discontinuity data structures (data structures 5–7); the data-generating equations for the exposure do not include x2 (see Web Appendix and Web Figure 1C for data-generating equations). Although x2 is not included in the equation for the exposure in any of the discontinuity data structures, it is still a confounder for the exposure-outcome relationship because of its relationship with the exposure through x1. D) Exposure ratio 8:92 data structures (data structures 8 and 9); x2 is not included in the generation of the exposure or the outcome, so x2 is not a confounder.
