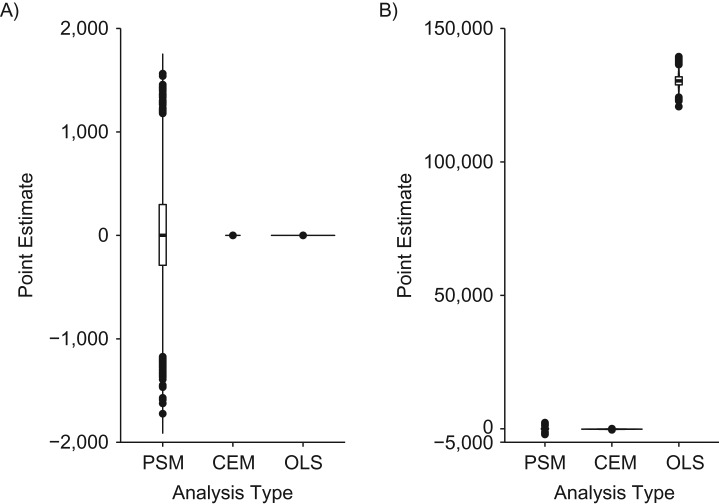
Figure 6.
Distribution of propensity score matching (PSM), coarsened exact matching (CEM), and ordinary least squares (OLS) regression point estimates in data structures where the ratio of exposed observations to unexposed observations is 8:92. A) “Exposure ratio 8:92 confounder-outcome linear” data structure (data structure 8); B) “exposure ratio 8:92 confounder-outcome quadratic” data structure (data structure 9). PSM, CEM, and OLS point estimates were unbiased, on average, when applied to the “exposure ratio 8:92, confounder-outcome linear” data structure (data structure 8); however, the distribution of PSM estimates was larger than that of the CEM or OLS estimates. When analytical models were applied to the “exposure ratio 8:92, confounder-outcome quadratic” data structure (data structure 9), PSM and CEM point estimates were unbiased, on average, while OLS estimates were biased, on average. Our proposed empirical “rule of thumb” indicates that OLS inferences are unbiased more often than matching inferences in the first scenario (i.e., the type I error rate approximates 5%, while the PSM and CEM type I error rates vary from the expected 5%), while matching inferences are unbiased more often than OLS estimates in the second scenario (i.e., the OLS type I error rate is 100%, while the matching type I error rates are less than 5%; see Table 1 for more information).

