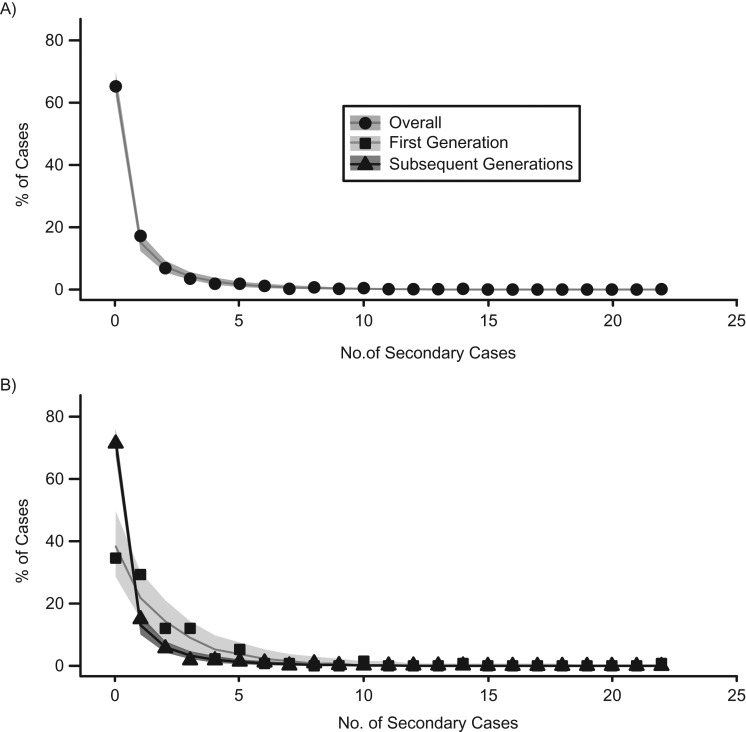
Figure 3.
Distribution of secondary cases, Ebola epidemic, Guinea, 2014–2016. A) Distribution of the number of secondary cases per case, fitted to a negative binomial distribution (line and shaded areas). B) Fits of the first or the subsequent generations only (total: mean, 0.89 (standard deviation, 0.31; 95% confidence interval: 0.25, 0.37); first generation: mean, 1.77 (standard deviation, 0.88; 95% confidence interval: 0.53, 1.23); subsequent generations: mean, 0.70 (standard deviation, 0.25; 95% confidence interval: 0.19, 0.30)).

