
Figure 5.
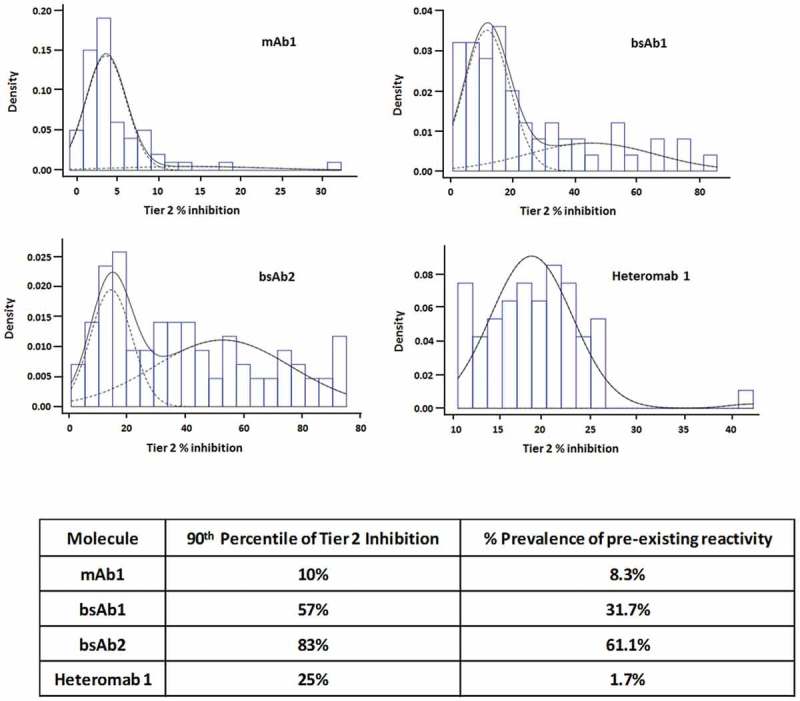
Pre-existing reactivity data reported as “prevalence”. (a), Histograms of the distribution of Tier 2 inhibition for each molecule; the dashed curves show the two mixture components; the black curve shows the sum of the two dashed curves. (b), Table summarizing the pre-existing reactivity as the 90th percentile of Tier 2 inhibition and as prevalence.