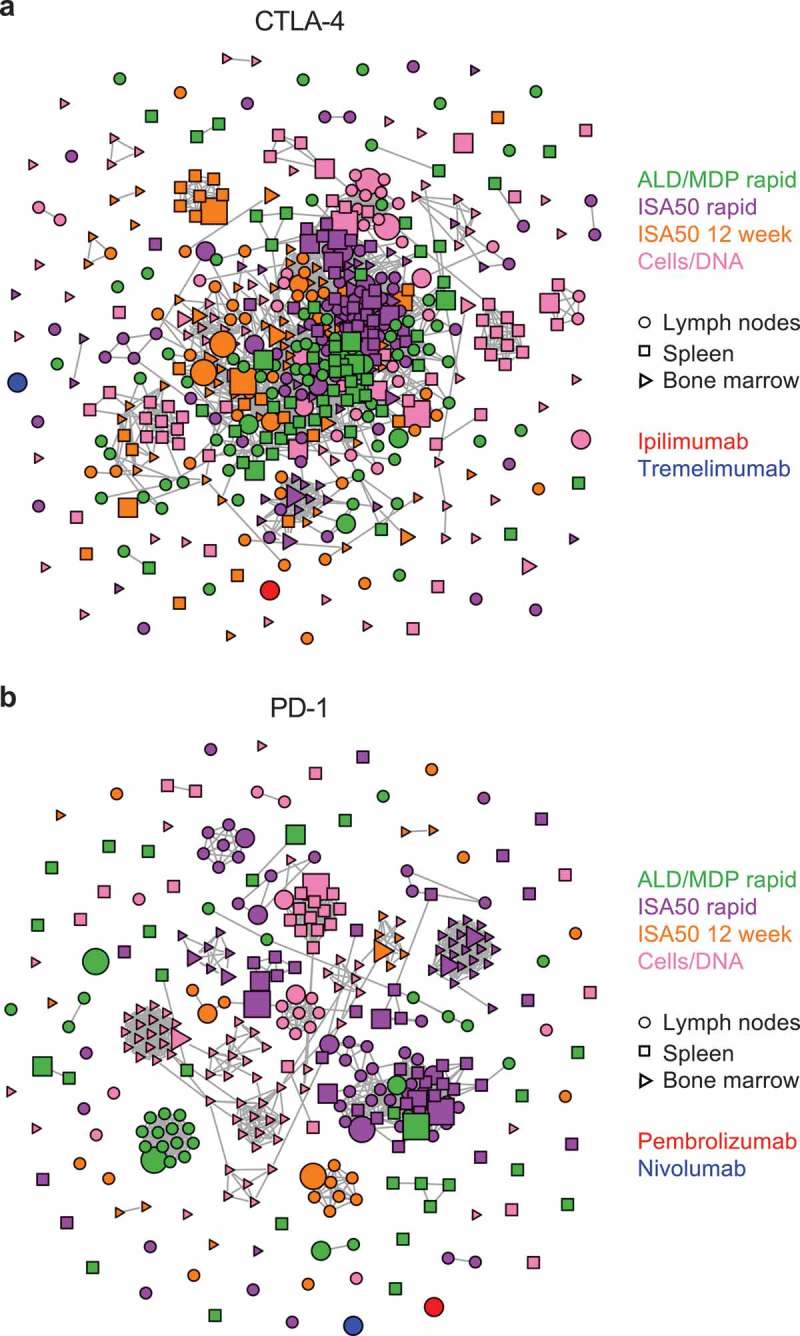
Figure 7.

Clonal cluster analysis for the FACS-enriched scFv clones. Each node represents an scFv clone (full-length IgK+IgH). The color of the nodes indicates the immunization method from which the scFv clones were derived. The size of the nodes reflects the frequency of the scFv clones in the FACS-sorted population (small = 0.1–3%; medium = 3–12%; large = >12%). The shape of the nodes indicates the mouse tissue origin from which the clones were derived. We computed the total number of amino acid differences between each pairwise alignment of scFv sequences. Edges indicate pairwise alignments with ≤9 amino acid differences. (a) Clonal clusters for CTLA-4 binders. The scFv sequences for two mAbs against CTLA-4, ipilimumab and tremelimumab, were included for comparison. (b) Clonal clusters for PD-1. The scFv sequences for two mAbs against PD-1, pembrolizumab and nivolumab, were included for comparison. The size and shape parameters do not apply to the mAbs.
