Figure 1.

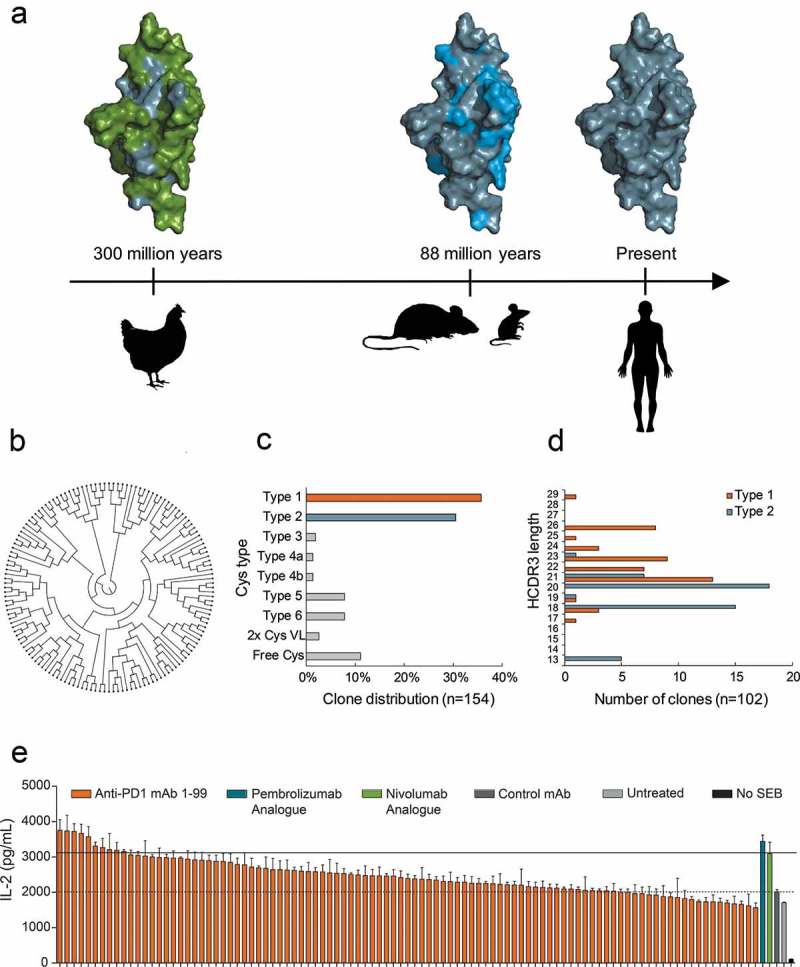
a Amino acid residue differences shown by the coloring of surface-exposed residues in extracellular domain of PD1. Human/common (gray), different in chicken (green), different in mouse (blue). Timeline (arrow) indicates evolutionary time distance since common ancestor.6 b ClustalO analysis of 144 chicken-derived antibodies shows high sequence diversity as displayed in a circular cladogram. c Distribution of Cys configuration in repertoire into distinct types as defined previously.10 d HCDR3 length distribution of antibodies with Cys type 1 (orange) and type 2 (blue) configuration. e Waterfall plot showing a ranking of 99 humanized anti-PD1 antibodies tested for functional activity in an SEB whole blood assay at 1 µg/ml. Analogue of pembrolizumab and nivolumab were included as a positive control, and the negative control mAb was a human IgG1 LALA that binds to an irrelevant non-human antigen. IL-2 levels in the supernatants were determined after 48 h of culture. Horizontal lines indicate IL-2 levels after treatment with control mAb (dashed) or nivolumab analogue (solid). Each bar represents mean ± SEM (n = 3).
