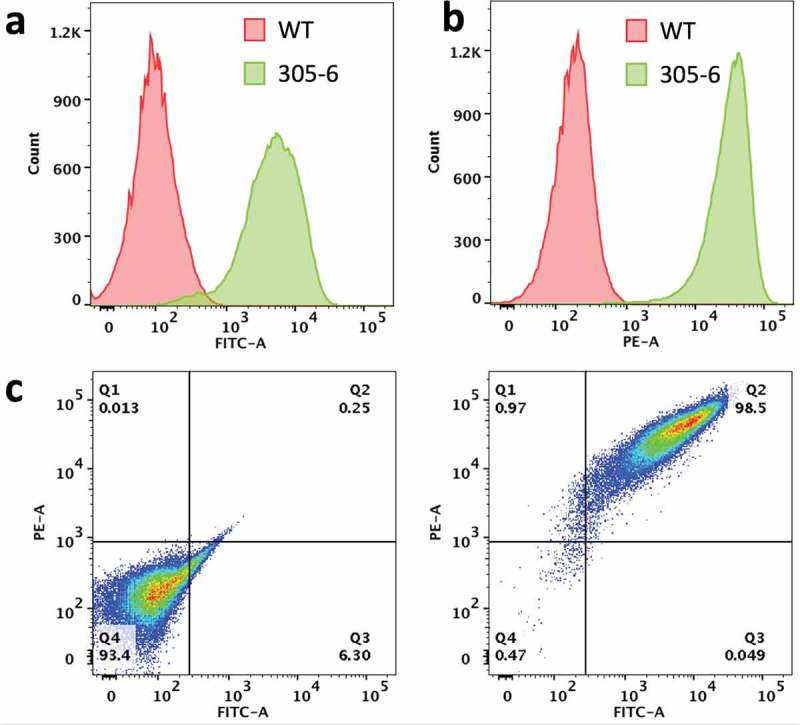
Figure 1.

Expression of human FcRn heavy chain and B2M in the clonal MDCK cell line (MDCK-hFcRn; 305-6). (a) Flow cytometry histogram of cell surface expression of B2M in WT and 305-6 cells. (b) Flow cytometry histogram of cell surface expression of FCGRT in WT and 305-6 cells. (c) Flow cytometry data represented as a dot-plot: cell surface expression of FCGRT (y-axis) and B2M (Xx-axis) in WT (left panel) and 305-6 (right panel) cells.
