
Figure 4.
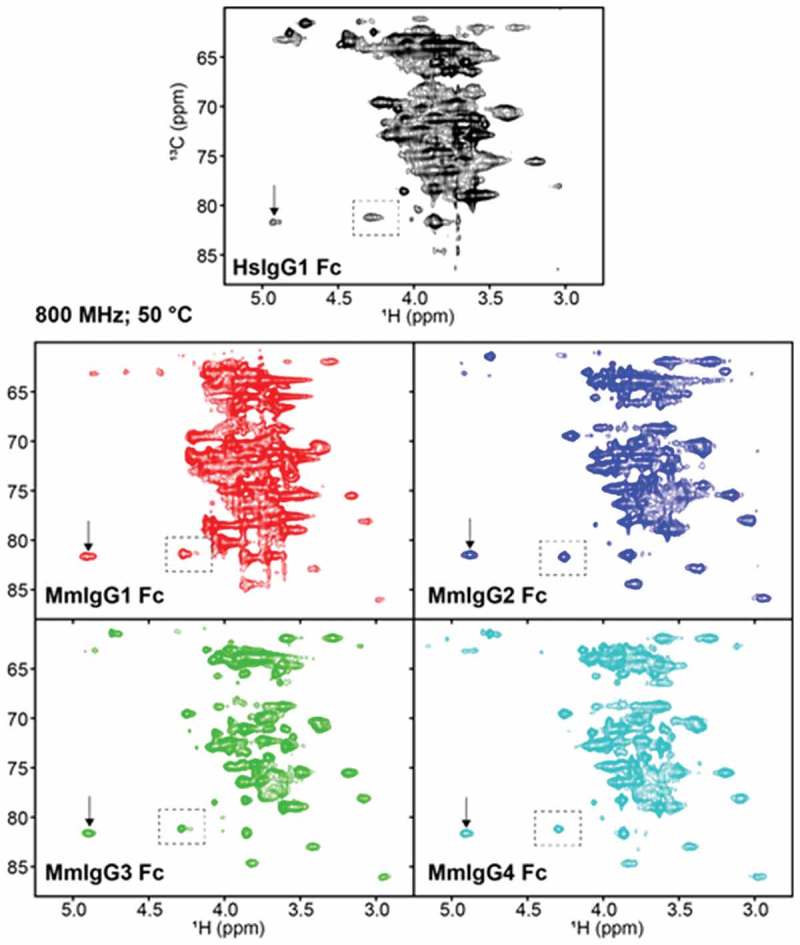
Differences in spectral quality in 1H-13C HSQC spectra of [13CU-glycan]-Fcs collected at 18.8 T and 50ºC. These spectra were processed with only a sine-squared line-broadening function in the direct dimension. The vertical arrow highlights the peak which corresponds to the GlcNAc1 H6-C1 correlation. Peaks within the dashed boxes are used for comparisons of spectra in the main text.