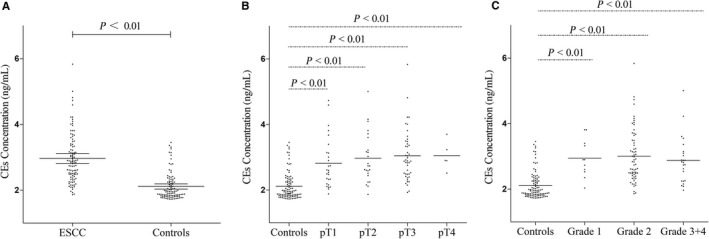
Figure 2.

Concentration levels of CEs in the serum from esophageal squamous cell carcinoma (ESCC) patients and healthy controls. (A) Scatter plots of CEs concentration in serum from patients with ESCC (n = 100) and healthy controls (n = 100). Mean CEs concentration was significantly higher in the serum from patients with ESCC (Mean: 2.97 ng/mL, 95% CI: 2.82‐3.12) compared with circulating exosomes (CEs) concentration from control subjects (Mean: 2.11 ng/mL, 95% CI: 2.03‐2.20) (P < 0.01). Scatter plots of concentrations levels of CEs in the ESCC patients with different tumor sizes (B) and grades (C). Each of these parameters including pT1 (P < 0.01) and grade 1 (P < 0.01) patients had significantly higher CEs concentration compared with the control subjects. The lines represented the medians. Mann‐Whitney U test was used to determine statistical significance
