
Figure 4.
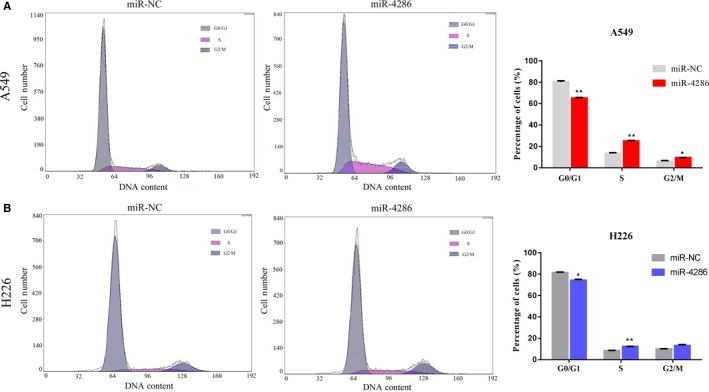
Analysis of NSCLC cell lines by flow cytometry (miR‐4286 vs. miR‐NC cells). Cells were harvested after transfection for 72 hours and then stained with propidium iodide. The proportion of cells for respective periods of cell cycle is shown in the inset of each panel, in which the numbers represent the average value of measurement for three times