Figure 1.

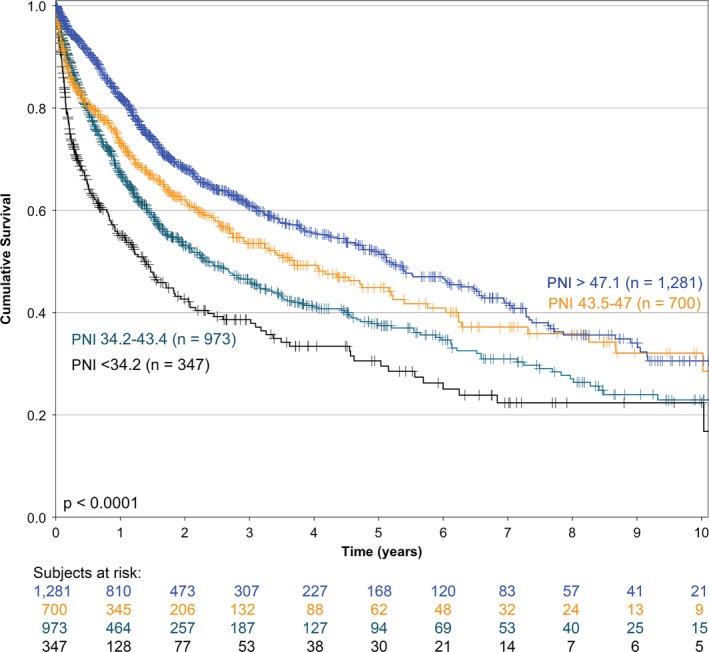
Kaplan‐Meier overall survival curves of all patients in the cohort according to the prognostic nutritional index (n = 3301)

Kaplan‐Meier overall survival curves of all patients in the cohort according to the prognostic nutritional index (n = 3301)