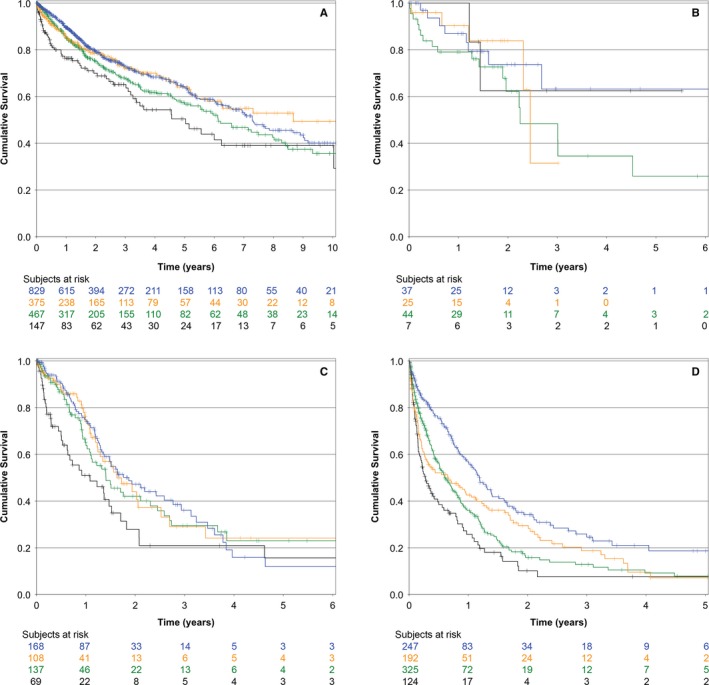
Figure 3.

Kaplan‐Meier overall survival curves of all patients in the cohort according to the prognostic nutritional index across R classification strata (stratified analysis P < 0.0001). A, R0 surgical resection; B, R1 surgical resection; C, R2 surgical resection; D, no surgical resection performed. Blue line, first and second quintile; yellow line, third quintile; green line, fourth quintile; black line, fifth quintile
