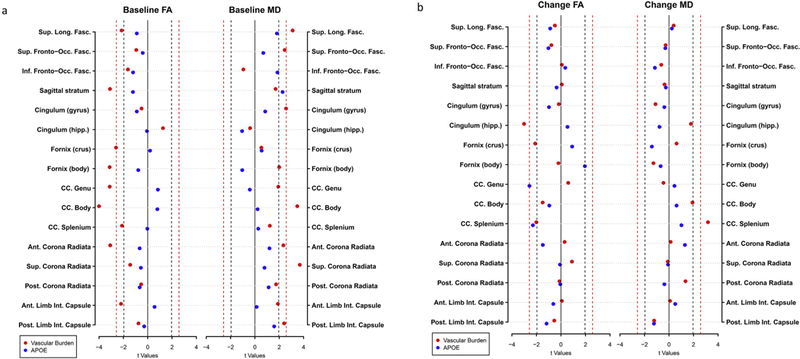
Fig. 3.

Dot plots showing the effects of the vascular burden (red) and having an APOE ε4 allele (blue) on (a) baseline FA and MD and (b) change in FA and MD. The dashed lines represent the thresholds for significance for p = 0.05 (black) and p = 0.01 (red). Moving from zero, points on the outside of the dashed lines represent significant effects. Covariates included age, sex, race, and scanner.
